
Figure 2
- ID
- ZDB-IMAGE-220302-149
- Publication
- Rajaei et al., 2022 - The LCP Family Protein, Psr, Is Required for Cell Wall Integrity and Virulence in Streptococcus agalactiae
- All Figures
- Figures for Rajaei et al., 2022
|
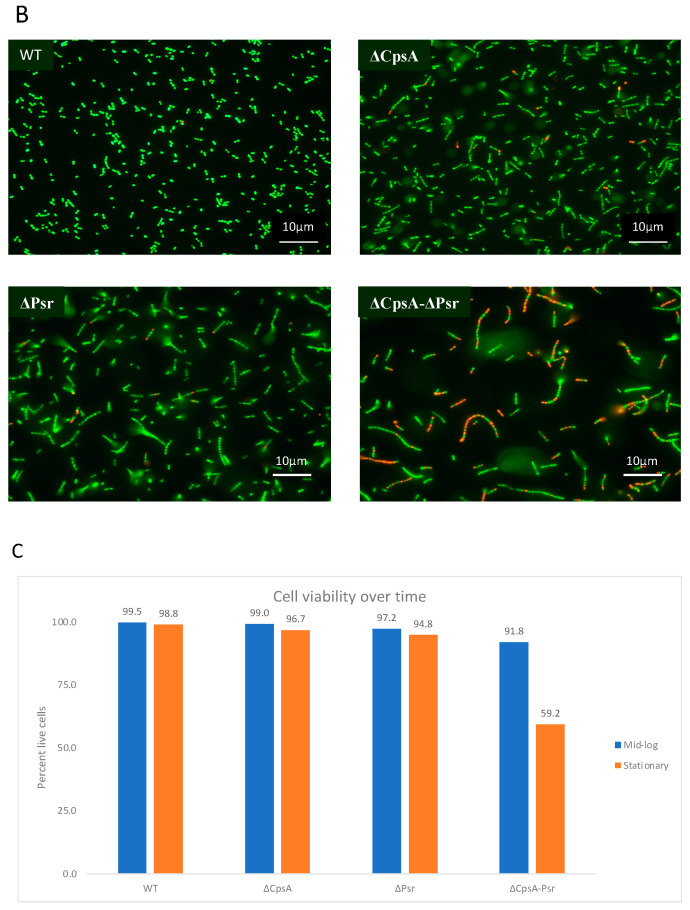
Figure 2
GBS cell viability is significantly affected at stationary phase. GBS strains were grown to mid-log and stationary phase in THY medium, normalized to OD600: 0.6 in 0.85% NaCl and treated with live/dead stain. (A) Images of cells grown to mid-log phase, where green cells represent live cells and red cells represent dead cells. (B) Images of cells grown to stationary phase, where green cells represent live cells and red cells represent dead cells. (C) Percentage of live cells were quantified. Micrographs of each strain were imaged and 10 fields of view per strain were used to quantify percentage of live cells.