
- Title
-
Identification of enhancer regulatory elements that direct epicardial gene expression during zebrafish heart regeneration
- Authors
- Cao, Y., Xia, Y., Balowski, J.J., Ou, J., Song, L., Safi, A., Curtis, T., Crawford, G.E., Poss, K.D., Cao, J.
- Source
- Full text @ Development
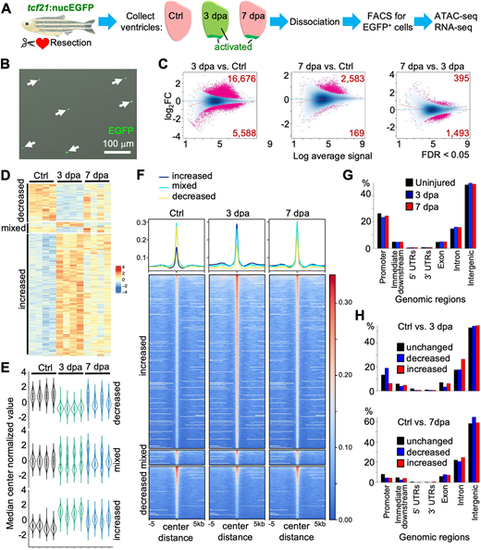
ATAC-seq analysis reveals dynamic chromatin accessibility in epicardial cells during heart regeneration. (A) Schematic for experimental design. Partial resection injuries were carried out in tcf21:nucEGFP animals. Ventricles were collected at 3 or 7 dpa, as were those of uninjured clutchmates (Ctrl). Areas of epicardial activation are labeled in green. Ventricles were dissociated, EGFP+ epicardial cells were isolated by FACS, and bulk RNA-seq and ATAC-seq were performed. (B) FACS-isolated cells in a culture dish to examine survival, morphology and EGFP signals. Arrows indicate EGFP+ cells. (C) MA plots of Log2 fold changes (Log2FC) over average normalized ATAC-seq signals. Pink dots indicate peaks with significantly changed chromatin accessibility with the numbers of differential peaks labeled in the corners (FDR<0.05). (D) Heat map of differential chromatin accessibility across three groups with four replicates each. Three clusters (increased, mixed and decreased) are indicated on the left. Increased, peaks with increased accessibility in both 3 and 7 dpa samples; decreased, peaks with decreased chromatin accessibility in both 3 and 7 dpa samples compared with the uninjured control; mixed, peaks with different trends in 3 and 7 dpa samples, compared with the control. (E) Violin plots of differential peaks of three clusters across samples, showing the distribution pattern of chromatin accessibility across samples. (F) Heat map shows the signals of ATAC-seq within ±5 kb of the peak centers. The blue, cyan and yellow lines at the top represent mean read densities of the corresponding ATAC-seq peaks at increased, mixed and decreased chromatin accessibility, respectively. (G) Genomic distributions of all ATAC-seq peaks in three groups. (H) Genomic distributions of the differential and unchanged regions in pair-wise comparisons (top, 3 dpa versus Ctrl; bottom, 7 dpa versus Ctrl). |
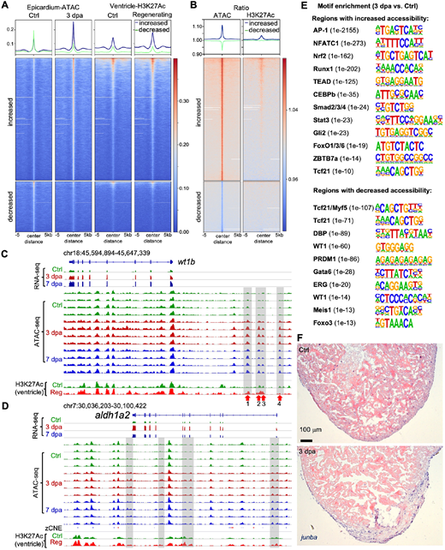
Chromatin accessibility indicates regulatory programs of epicardium during heart regeneration. (A) Heat map with signals of ATAC-seq and ChIP-seq within ±5 kb of the peak centers. The blue and green lines at the top represent mean read densities of the corresponding ATAC-seq peaks with increased and decreased chromatin accessibility (3 dpa versus Ctrl), respectively. (B) Heat map indicates ratios of the signals shown in A. 3 dpa/Ctrl for ATAC-seq (left) and regenerating/Ctrl for ChIP-seq (right). (C,D) Browser tracks of the genomic region containing the gene wt1b or aldh1a2 showing the transcripts and chromatin accessibility profiles in the epicardium across replicates from Ctrl, 3 dpa and 7 dpa samples. The whole-ventricle H3K27Ac profile of the uninjured (Ctrl) and regenerating (Reg) hearts is shown at the bottom. Gray boxes indicate ATAC-seq peaks with increased accessibility during regeneration. (E) Enriched motifs in the open chromatin regions with increased (top) or decreased (bottom) accessibility at 3 dpa. P-value for each enriched TF is shown in the bracket. (F) In situ hybridization results show junba expression in presumed epicardial cells at 3 dpa and in the uninjured heart. Scale bar: 100 µm. |
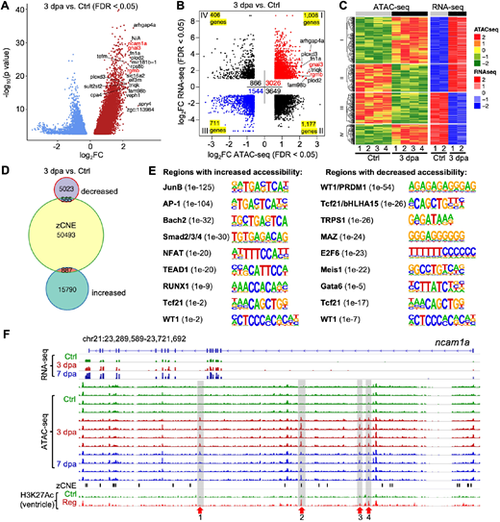
Candidate regulatory elements for enhancer activity during heart regeneration. (A) Volcano plot of differential ATAC-seq peaks in 3 dpa versus uninjured (Ctrl) samples. The top 20 upregulated peaks with the highest fold changes are marked with the annotated genes. ncam1a, gnai3 and rgmb are in red. N/A, no gene is annotated to the peak. (B) Dot plot of differential ATAC-seq peaks linked to nearby differential transcripts in 3 dpa versus uninjured (Ctrl) samples. Each dot indicates an individual ATAC-seq peak and is counted into the total peak numbers of each quadrant. The number of unique genes in each quadrant is indicated in each corner. The most differential peaks of a few genes are marked with gnai3 and rgmb in red. (C) Heat map of differential transcripts in 3 dpa versus uninjured (Ctrl) linked to nearby differentially accessible chromatin regions. (D) Venn diagram comparison of differentially regulated ATAC-seq peaks in 3 dpa versus uninjured compared with the zCNE list. (E) Enriched motifs in the conserved open chromatin regions with increased (left) or decreased (right) accessibility at 3 dpa. P-value for each enriched TF is shown in the bracket. (F) Browser tracks of the genomic region near gene ncam1a showing the transcripts and chromatin accessibility profiles in the epicardium. The whole-ventricle H3K27Ac profile of the uninjured (Ctrl) and regenerating (Reg) heart is shown at the bottom. zCNE sites are depicted as short black bars. Gray boxes, red arrows and numbers indicate candidate TREEs. |
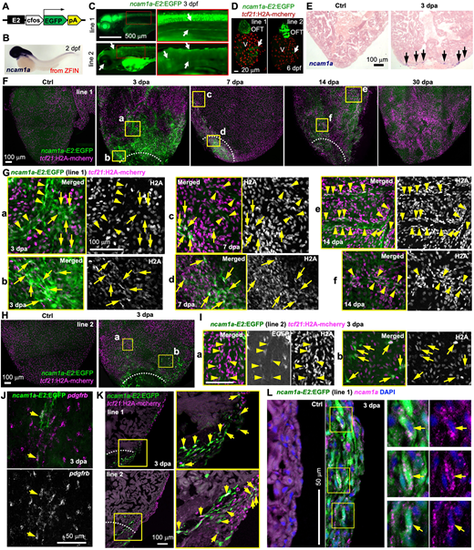
ncam1a-E2 directs injury-induced epicardial gene expression. (A) The ncam1a-E2:EGFP reporter construct. (B) Whole-mount in situ hybridization showing ncam1a expression in a 2 dpf embryo. Adapted, with permission, from ZFIN (Ruzicka et al., 2019; Thisse and Thisse, 2004; Thisse et al., 2008). (C) Larval expression of ncam1a-E2:EGFP lines at 3 dpf. Higher magnification views of the outlined regions are shown on the right. Scale bar: 500 µm. Arrows indicate representative EGFP signals. (D) Whole-mount images of 6 dpf hearts showing EGFP expression in the outflow tract (OFT) and the atrioventricular valves (arrows). tcf21:H2A-mCherry (red) labels the epicardial cells. V, ventricle. Arrows indicate EGFP signals in the atrioventricular valve. Scale bar: 20 µm. (E) In situ hybridization results showing ncam1a expression in presumed epicardial cells around the injury site at 3 dpa (arrows). Arrows indicate representative in situ signals. Scale bar: 100 µm. (F) Whole-mount images (maximum projections of z-stacks) of the ventricular surface showing expressions of ncam1a-E2:EGFP line 1 (green) in uninjured (Ctrl) and 3, 7, 14 and 30 dpa samples. tcf21:H2A-mCherry (magenta) labels the epicardial cells. White dashed lines indicate the injury sites. The regions outlined in yellow are enlarged in G. Scale bar: 100 µm. (G) Single optical slice of confocal images of the outlined regions in F. Arrows and arrowheads indicate representative cells that express both EGFP (green) and tcf21:H2A-mCherry (magenta). Arrowheads in a,c,e,f also indicate possible tcf21+ perivascular cells. Scale bar: 100 µm. (H) Whole-mount images (maximum projections) of the ventricular surface showing expression of ncam1a-E2:EGFP line 2 (green) in uninjured (Ctrl) and 3 dpa samples. Magnified views of the outlined region are shown in I. (I) Single optical section of confocal images of the outlined regions in H. Single-channel images are shown in grayscale. Arrows and arrowheads (presumed perivascular) indicate representative double-positive cells. Scale bar: 100 µm. (J) HCR staining result of pdgfrb (magenta) on a whole-mounted heart carrying the ncam1a-E2:EGFP reporter (line 2, green, anti-EGFP antibody staining). Single-channel image shows staining signals of pdgfrb. Arrows indicate EGFP+pdgfrb+ cells. Scale bar: 50 µm. (K) Section images demonstrating expression of ncam1a-E2:EGFP (green) in tcf21:H2A-mCherry+ (magenta) cells. Magnified views of the outlined regions are shown on the right. White dashed lines indicate the injury sites. Scale bar: 100 µm. Arrows indicate representative double-positive cells. (L) HCR staining of ncam1a (magenta dots) on ventricular sections (ctrl, 3 dpa) showing ncam1a-E1:EGFP expression (line 1, green) in ncam1a+ cells. The outlined regions are enlarged on the right. Arrows indicate EGFP+ncam1a+ cells. No definitive epicardial expression of ncam1a was observed in the Ctrl samples. Some nonspecific background staining is evident in the muscle. Scale bar: 50 µm. |
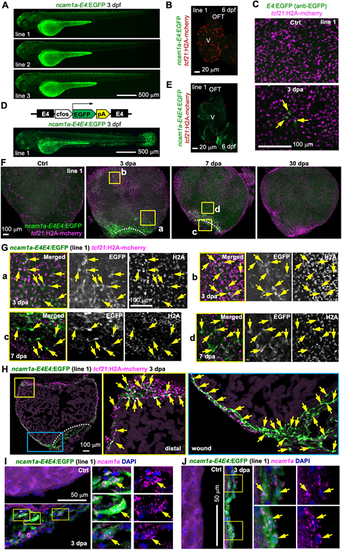
ncam1a-E4 directs injury-induced epicardial gene expression. (A) Larval expression of ncam1a-E4:EGFP lines. Scale bar: 500 µm. (B) Whole-mount image of a 6 dpf heart with tcf21:H2A-mCherry (red) labeling the epicardial cells. No EGFP expression was observed. V, ventricle. Scale bar: 20 µm. (C) Whole-mount images (maximum projections) of the ventricular surface showing expression of a ncam1a-E4:EGFP line in uninjured (Ctrl) and 3 dpa samples. Anti-EGFP antibody staining was used to detect the EGFP expression. Scale bar: 100 μm. (D) Top: the ncam1a-E4E4:EGFP reporter construct. Bottom: larval expression of ncam1a-E4E4:EGFP reporter line. Scale bar: 500 µm. (E) Optical section image of a 6 dpf heart (whole-mounted) showing EGFP expression in the muscle. tcf21:H2A-mCherry (red) labels the epicardial cells. V, ventricle. Scale bar: 20 µm. (F) Whole-mount images (maximum projections) of the ventricular surface showing expressions of ncam1a-E4E4:EGFP line 1 (green) in uninjured (Ctrl) and 3, 7 and 30 dpa samples. tcf21:H2A-mCherry (magenta) labels the epicardial cells. White dashed lines indicate the injury sites. The outlined regions are enlarged in G. Scale bar: 100 µm. (G) Single optical section of confocal images from the regions outlined in F. Single-channel images are shown in grayscale. Arrows indicate representative GFP+mCherry+ cells. Scale bar: 100 µm. (H) Section images demonstrating expression of ncam1a-E4E4:EGFP (green) in tcf21:H2A-mCherry+ (magenta) cells. Magnified views of the outlined regions are shown on the right (distal and wound regions). White dashed lines indicate the injury sites. Arrows indicate representative double-positive cells. Scale bar: 100 µm. (I,J) HCR staining of ncam1a (magenta dots) on ventricular sections (ctrl, 3 dpa) showing ncam1a-E4E4:EGFP expression (green) in ncam1a+ cells both in the wound (I) and distal (J) regions. The outlined regions are enlarged on the right. Arrows indicated EGFP+ncam1a+ cells. Scale bars: 50 µm. |
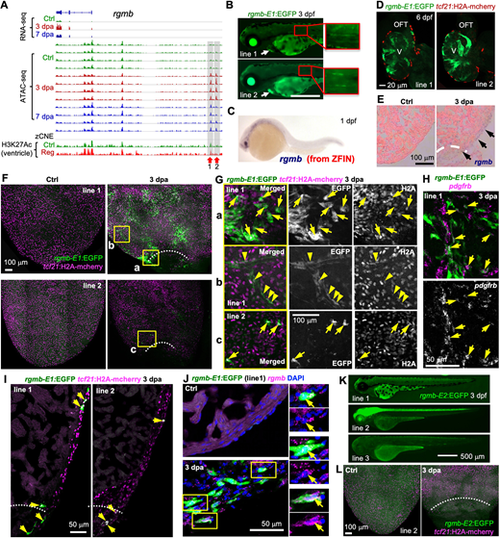
A rgmb-linked TREE directs injury-induced epicardial gene expression. (A) Browser tracks of the genomic region near gene rgmb showing the transcripts and chromatin accessibility profiles in the epicardium. The whole-ventricle H3K27Ac profile of the uninjured (Ctrl) and regenerating (Reg) heart is shown at the bottom. Gray boxes, red arrows and numbers indicate candidate TREEs. (B) Larval expression of rgmb-E1:EGFP lines at 3 dpf. Arrows indicate the heart. Scale bar: 500 µm. (C) Whole-mount in situ hybridization showing rgmb expression in a 1 dpf embryo. Adapted, with permission, from ZFIN (Ruzicka et al., 2019; Thisse and Thisse, 2004; Thisse et al., 2008). (D) Optical section images of 6 dpf hearts (whole-mounted) showing EGFP expression in the muscle. tcf21:H2A-mCherry (red) labels the epicardial cells. V, ventricle. Scale bar: 20 µm. (E) In situ hybridization results showing injury-induced rgmb expression on the ventricular surface (arrows) at 3 dpa. Dashed line indicates the injury site. (F) Whole-mount images (maximum projections) of the ventricular surface showing expression of the rgmb-E1:EGFP reporter lines (green, anti-EGFP antibody staining) in uninjured (Ctrl) and 3 dpa samples. tcf21:H2A-mCherry (magenta) labels the epicardial cells. White dashed lines indicate the injury sites. The outlined regions are enlarged in G. Scale bar: 100 µm. (G) Single optical sections of confocal images of the outlined regions in F. Single-channel images are shown in grayscale. Arrows and arrowheads indicate representative EGFP+mCherry+ cells. Arrowheads in b indicate presumed perivascular cells. Scale bar: 100 µm. (H) HCR staining result of pdgfrb (magenta) on a whole-mount heart carrying the rgmb-E1:EGFP reporter (line 1, green, anti-EGFP antibody staining). Single-channel image shows staining signals of pdgfrb. Arrows indicate EGFP+pdgfrb+ cells. Scale bar: 50 µm. (I) Section images demonstrating expression of rgmb-E1:EGFP (green, anti-EGFP antibody staining) in tcf21:H2A-mCherry+ (magenta) cells. Arrows indicate representative double-positive cells. Scale bar: 50 µm. (J) HCR staining of rgmb (magenta dots) on ventricular sections (ctrl, 3 dpa) showing rgmb-E1:EGFP expression (green, anti-EGFP antibody staining) in rgmb+ cells. The outlined regions are enlarged on the right. Arrows indicate EGFP+rgmb+ cells. Scale bar: 50 µm. (K) Larval expression of rgmb-E2:EGFP lines. Scale bar: 500 µm. (L) Whole-mount images (maximum projections) of the ventricular surface showing no EGFP induction in the 3 dpa sample carrying the rgmb-E2:EGFP reporter. tcf21:H2A-mCherry (magenta) labels the epicardial cells. White dashed lines indicate the injury site. Scale bar: 100 µm. |
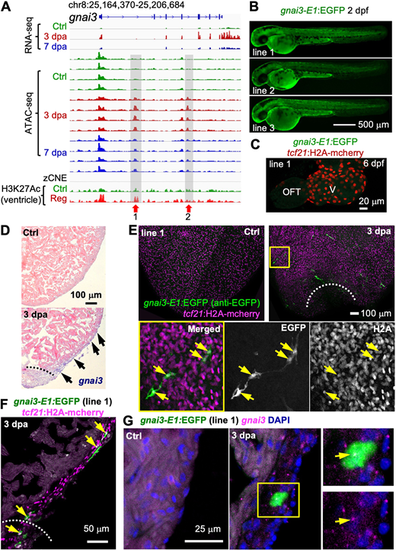
A gnai3-linked TREE directs injury-induced epicardial gene expression. (A) Browser tracks of the genomic region near gnai3 showing the transcripts and chromatin accessibility profiles in the epicardium, the zCNE sites and the whole-ventricle H3K27Ac profile. Gray boxes, red arrows and numbers indicate candidate TREEs. (B) Larval expression of three gnai3-E1:EGFP reporter lines. Scale bar: 500 µm. (C) Whole-mount image of a 6 dpf heart showing no GFP expression. tcf21:H2A-mCherry (red) labels the epicardial cells. V, ventricle. Scale bar: 20 µm. (D) In situ hybridization results showing gnai3 expression in presumed epicardial cells (arrows) at 3 dpa. Dashed line indicates the injury site. Scale bar: 100 µm. (E) Whole-mount images (maximum projections) of the ventricular surface showing gnai3-E1:EGFP expression in tcf21:H2A-mCherry+ cells. An enlarged view of the outlined region is displayed at the bottom with single-channel image shown in grayscale (single optical sections). White dashed line indicates the injury sites. Arrows indicate representative EGFP+mCherry+ cells. Scale bar: 100 µm. (F) Section images demonstrating expression of gnai3-E1:EGFP (green, anti-EGFP antibody staining) in tcf21:H2A-mCherry+ (magenta) cells. Arrows indicate representative double-positive cells. Scale bar: 50 µm. (G) HCR staining of gnai3 (magenta dots) on ventricular sections (ctrl, 3 dpa) showing gnai3-E1:EGFP expression (green, anti-EGFP antibody staining) in gnai3+ cells. The outlined region is enlarged on the right. Arrows indicate an EGFP+gnai3+ cell. Scale bar: 25 µm. |
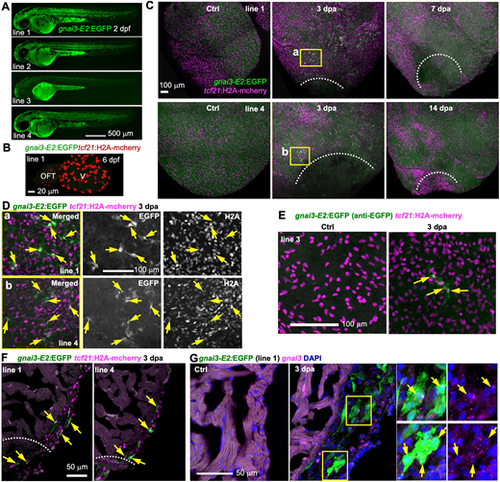
gnai3-E2 directs similar injury-induced epicardial gene expression as gnai3-E1. (A) Larval expression of four gnai3-E2:EGFP reporter lines. Scale bar: 500 µm. (B) Whole-mount image of a 6 dpf heart showing no EGFP expression. tcf21:H2A-mCherry (red) labels the epicardial cells. V, ventricle. Scale bar: 20 µm. (C) Whole-mount images (maximum projections) of the ventricular surface showing expression of the gnai3-E2:EGFP lines 1 and 4 (green) in uninjured (Ctrl) and 3, 7 and 14 dpa samples. tcf21:H2A-mCherry (magenta) labels the epicardial cells. White dashed lines indicate the injury sites. The outlined regions are enlarged in D. Scale bar: 100 µm. (D) Single optical section of confocal images of the outlined regions in C. Single-channel images are shown in grayscale. Arrows indicate representative EGFP+mCherry+ cells. Scale bar: 100 µm. (E) Whole-mount images (maximum projection) showing expression of the gnai3-E2:EGFP reporter line 3. A few EGFP+; tcf21:H2A-mCherry+ cells were seen upon injury (arrows). Scale bar: 100 µm. (F) Section images demonstrating expression of gnai3-E2:EGFP (green, anti-EGFP antibody staining) in tcf21:H2A-mCherry+ (magenta) cells. Arrows indicate representative double-positive cells. Scale bar: 50 µm. (G) HCR staining of gnai3 (magenta dots) on ventricular sections (ctrl, 3 dpa) showing gnai3-E2:EGFP expression (green, anti-EGFP antibody staining) in gnai3+ cells. The outlined regions are shown on the right. Arrows indicate EGFP+gnai3+ cells. Scale bar: 50 µm. |