
Fig. 2
- ID
- ZDB-FIG-231215-92
- Publication
- Cao et al., 2022 - Identification of enhancer regulatory elements that direct epicardial gene expression during zebrafish heart regeneration
- Other Figures
- All Figure Page
- Back to All Figure Page
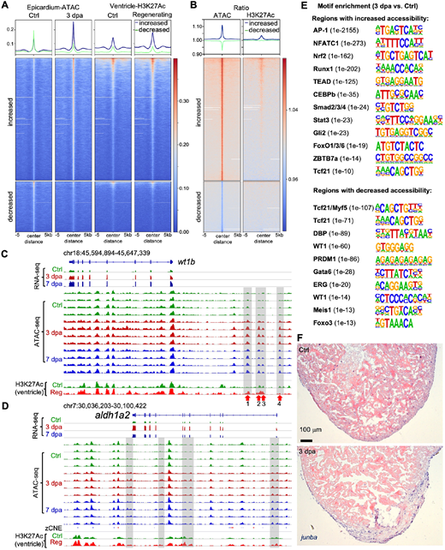
Chromatin accessibility indicates regulatory programs of epicardium during heart regeneration. (A) Heat map with signals of ATAC-seq and ChIP-seq within ±5 kb of the peak centers. The blue and green lines at the top represent mean read densities of the corresponding ATAC-seq peaks with increased and decreased chromatin accessibility (3 dpa versus Ctrl), respectively. (B) Heat map indicates ratios of the signals shown in A. 3 dpa/Ctrl for ATAC-seq (left) and regenerating/Ctrl for ChIP-seq (right). (C,D) Browser tracks of the genomic region containing the gene wt1b or aldh1a2 showing the transcripts and chromatin accessibility profiles in the epicardium across replicates from Ctrl, 3 dpa and 7 dpa samples. The whole-ventricle H3K27Ac profile of the uninjured (Ctrl) and regenerating (Reg) hearts is shown at the bottom. Gray boxes indicate ATAC-seq peaks with increased accessibility during regeneration. (E) Enriched motifs in the open chromatin regions with increased (top) or decreased (bottom) accessibility at 3 dpa. P-value for each enriched TF is shown in the bracket. (F) In situ hybridization results show junba expression in presumed epicardial cells at 3 dpa and in the uninjured heart. Scale bar: 100 µm. |