
|
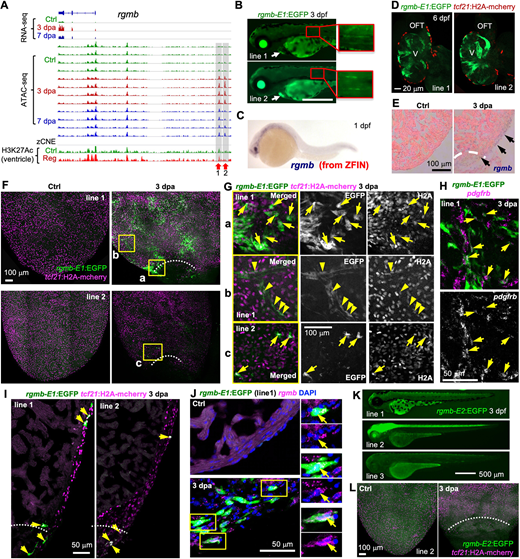
Fig. 6 A rgmb-linked TREE directs injury-induced epicardial gene expression. (A) Browser tracks of the genomic region near gene rgmb showing the transcripts and chromatin accessibility profiles in the epicardium. The whole-ventricle H3K27Ac profile of the uninjured (Ctrl) and regenerating (Reg) heart is shown at the bottom. Gray boxes, red arrows and numbers indicate candidate TREEs. (B) Larval expression of rgmb-E1:EGFP lines at 3 dpf. Arrows indicate the heart. Scale bar: 500 µm. (C) Whole-mount in situ hybridization showing rgmb expression in a 1 dpf embryo. Adapted, with permission, from ZFIN (Ruzicka et al., 2019; Thisse and Thisse, 2004; Thisse et al., 2008). (D) Optical section images of 6 dpf hearts (whole-mounted) showing EGFP expression in the muscle. tcf21:H2A-mCherry (red) labels the epicardial cells. V, ventricle. Scale bar: 20 µm. (E) In situ hybridization results showing injury-induced rgmb expression on the ventricular surface (arrows) at 3 dpa. Dashed line indicates the injury site. (F) Whole-mount images (maximum projections) of the ventricular surface showing expression of the rgmb-E1:EGFP reporter lines (green, anti-EGFP antibody staining) in uninjured (Ctrl) and 3 dpa samples. tcf21:H2A-mCherry (magenta) labels the epicardial cells. White dashed lines indicate the injury sites. The outlined regions are enlarged in G. Scale bar: 100 µm. (G) Single optical sections of confocal images of the outlined regions in F. Single-channel images are shown in grayscale. Arrows and arrowheads indicate representative EGFP+mCherry+ cells. Arrowheads in b indicate presumed perivascular cells. Scale bar: 100 µm. (H) HCR staining result of pdgfrb (magenta) on a whole-mount heart carrying the rgmb-E1:EGFP reporter (line 1, green, anti-EGFP antibody staining). Single-channel image shows staining signals of pdgfrb. Arrows indicate EGFP+pdgfrb+ cells. Scale bar: 50 µm. (I) Section images demonstrating expression of rgmb-E1:EGFP (green, anti-EGFP antibody staining) in tcf21:H2A-mCherry+ (magenta) cells. Arrows indicate representative double-positive cells. Scale bar: 50 µm. (J) HCR staining of rgmb (magenta dots) on ventricular sections (ctrl, 3 dpa) showing rgmb-E1:EGFP expression (green, anti-EGFP antibody staining) in rgmb+ cells. The outlined regions are enlarged on the right. Arrows indicate EGFP+rgmb+ cells. Scale bar: 50 µm. (K) Larval expression of rgmb-E2:EGFP lines. Scale bar: 500 µm. (L) Whole-mount images (maximum projections) of the ventricular surface showing no EGFP induction in the 3 dpa sample carrying the rgmb-E2:EGFP reporter. tcf21:H2A-mCherry (magenta) labels the epicardial cells. White dashed lines indicate the injury site. Scale bar: 100 µm.