
- Title
-
Somite morphogenesis is required for axial blood vessel formation during zebrafish embryogenesis
- Authors
- Paulissen, E., Palmisano, N.J., Waxman, J., Martin, B.L.
- Source
- Full text @ Elife
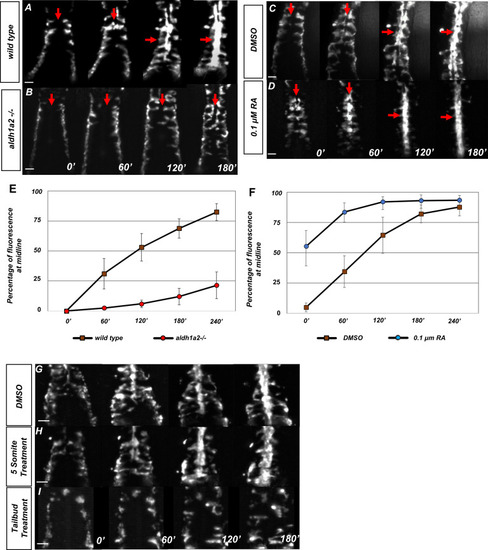
(A–D) Dorsal view of tg(kdrl:eGFP) embryos with representative images taken every 60 min over the course of 180 min, in (A) untreated (N = 12, see Video 1), (B) aldh1a2-/- mutants (N = 12, see Video 2), (C) DMSO-treated (N = 10), or (D) 0.1 µM RA-treated embryos (N = 8, see Video 3). The anterior of the embryo is at the top, and red arrows indicate the midline. (E, F) Graph of fluorescence intensity as angioblasts arrive at the midline for (E) wild-type and aldh1a2-/- and for (F) DMSO and 0.1 μM RA. Y-axis indicates the percentage of fluorescent intensity at midline relative to the fluorescence intensity of whole embryo. Time is measured on the X-axis. N = 8 for all conditions, error bars indicate standard deviation. (G–I) Time-lapse images of tg(kdrl:eGFP) embryos treated with either (G) DMSO vehicle (n = 10) or (H) 20 μM DEAB at the five-somite stage (n = 6), and (I) 20 μM DEAB at tailbud stage (n = 14). Scale bars, 50 µm.
|
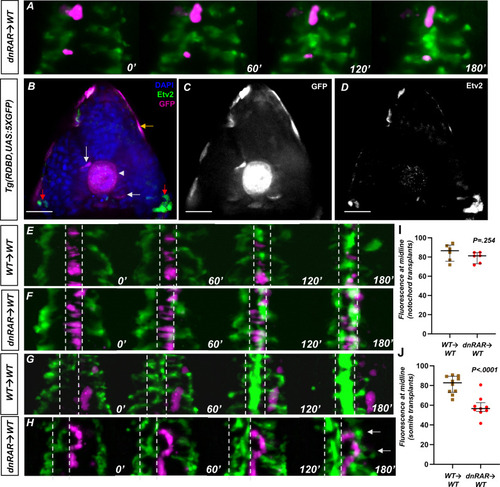
(A) Representative images of a time-lapse of tg(HS:dnRAR), tg(HS:id3) cells transplanted into a wild-type embryo. Cells labeled in magenta indicate migrating cells. These cells migrate along with the host angioblasts labeled by tg(kdrl:gfp), indicating normal migration patterns in the absence of cell-autonomous RA-depletion conditions (n = 3) (see Video 4). (B) DAPI-stained section of the 13-somite stage tg(RDBD,5XUAS:GFP) embryo, immunostained for GFP and Etv2 (n = 12). GFP signal is present in the adaxial region of the somite, the notochord, and the epidermis (white arrow, white arrowhead, and gold arrows, respectively). The red arrows indicate areas of Etv2 staining. (C) GFP channel of image in (B). (D) Etv2 channel of image in (B). Note the lack of overlap between Etv2 staining and GFP staining. (E) Representative images of a time-lapse of wild-type cells transplanted into a wild-type notochord. (F) Representative images of a time-lapse of tg(HS:dnRAR) cells transplanted into a wild-type notochord. (G) Representative images of a time-lapse of wild-type cells transplanted into a wild-type somite. (H) Representative images of a time-lapse of tg(HS:dnRAR) cells transplanted into a wild-type somite. White arrows indicate angioblast migration defects. (I) Quantification of midline fluorescence, as a percentage of total, for notochord transplants at 180′. The difference for wild-type and tg(HS:dnRAR) was not statistically significant (p=0.254). (J) Quantification of midline fluorescence, as a percentage of total, for somite transplants at 180′. The difference for wild-type and tg(HS:dnRAR) was statistically significant (p<0.0001). Scale bars, 50 µm.
|
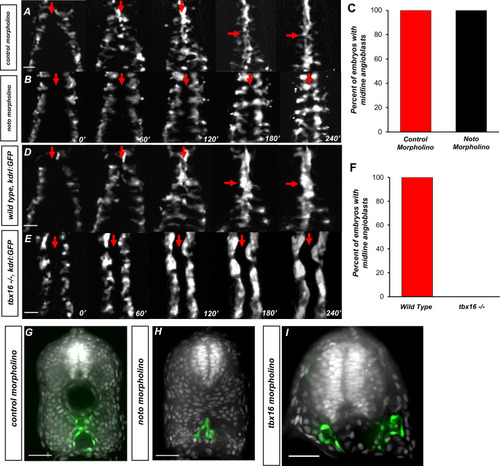
(A) Time-lapse imaging of tg(kdrl:eGFP) embryos injected with control morpholino over a 240′ period. (B) tg(kdrl:eGFP) embryos injected with noto morpholino over a 240′ period. Red arrows indicate the midline. (C) Graph of embryos with midline angioblasts in noto and control morphants after 240′. N = 15 for both conditions (D) Time-lapse imaging of wild-type, tg(kdrl:eGFP) embryos over a 240′ period. (E) Time-lapse imaging of tbx16-/-, tg(kdrl:eGFP) embryos over a 240′ period. Red arrows indicate the midline. (F) Graph of embryos with midline angioblasts in wild-type and tbx16-/- after 240′. N = 18 for both conditions. (G) Section of wild-type, tg(kdrl:eGFP) embryos over a 240′ period. (H) Section of 24 hpf tg(kdrl:eGFP) embryos injected noto morpholino and stained with DAPI. (I) Section of 24 hpf tg(kdrl:eGFP) embryos injected tbx16 morpholino. Blood vessels are labeled in green and nuclei labeled in gray. Scale bars, 50 µm.
|
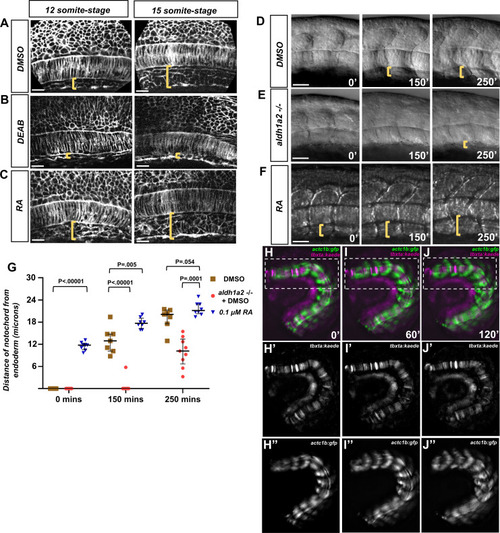
(A–C) Fluorescent images of fixed (A) DMSO-treated, (B), DEAD-treated, and (C) RA-treated tg(ubb:lck-mNG) embryo trunks at the 12- and 15-somite stage. Yellow brackets indicate the distance between the notochord and underlying yolk cell. (D–F) DIC time-lapse images of the notochord and zebrafish trunk. Focal planes of the notochord and somites were overlaid to show the relative location to one another. Yellow brackets indicate the distance of the ventral notochord to the ventral-most portion of the embryo in (D) DMSO-treated embryos, (E) aldh1a2-/- embryos treated with DMSO, or (F) 0.1 μM RA-treated embryos. (G) Quantification of dorsal translocation of notochord from the ventral tissue. Black lines indicate the median and interquartile range. Wild-type are indicated by brown squares, while aldh1a2-/- and 0.1 μM RA embryos are shown by red circles and blue triangles, respectively. At t = 0, DMSO vs. RA is p<0.00001. At 150′, DMSO is p<0.00001 and p=0.005 vs. aldh1a2-/- and RA treatment, respectively. At 250′, DMSO is p=0.0001 and 0.054 vs. aldh1a2-/- and RA treatment, respectively. (H–J) Time-lapse image of a trunk explant from tg(actc1b:gfp), tg(tbxta:kaede) embryo at (H) 0′, (I) 60′, and (J) 120′. (H’–J’) Time-lapse image of explant showing tg(tbxta:kaede) only. (H’’–J’’) Time-lapse image of explant showing tg(actc1b:gfp) only. Time-lapse shows the notochord adjacent the yolk at time 0′, but moves dorsally from the yolk at time 120′. Scale bars, 25 µm.
|
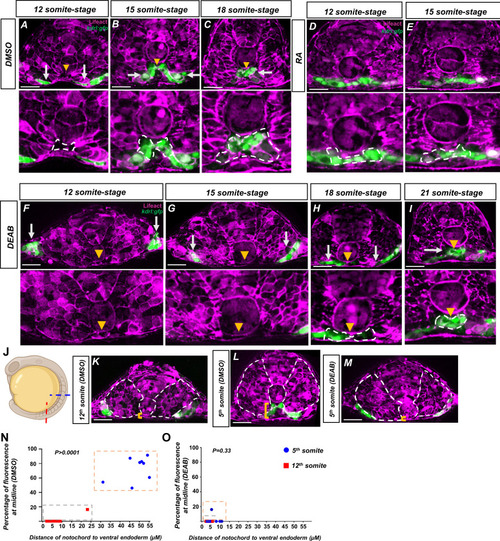
(A–I) Embryos generated by crossing tg(HS:lifeact) to tg(kdrl:eGFP) to label both actin and angioblasts. Yellow arrowheads indicate the midline while white arrows indicate angioblasts. A magnified image includes a white dashed line to indicate notochord-endoderm separation. (A–C) DMSO-treated embryos sectioned at the fifth somite during the (A) 12-somite stage (n = 8), (B) 15-somite stage (N = 8), and (C) 18-somite stage (N = 6). (D, E) 0.1 μM RA-treated embryos sectioned at the fifth somite during the (D) 12-somite stage (N = 8) and (E) 15-somite stage (n = 8). (F–I) 20 μM DEAB-treated embryos sectioned at the fifth somite during the (F) 12-somite stage (N = 7), (G) 15-somite stage (N = 8), (H) 18-somite stage (N = 6), and (I) 21-somite stage (N = 6). (J–L) 15-somite stage embryos generated by crossing tg(HS:lifeact) to tg(Kdrl:eGFP). White dashed lines indicate outline of somites while yellow brackets indicate distance of notochord to ventral endoderm. (J) Schematic showing the sectioned region for experiments in (K–O). Red line indicates sectioning at 5th somite, and the blue line indicates sectioning at the 12th somite. (K) A DMSO embryo sectioned at the 12th somite. Note the lack of midline angioblasts and small distance between the notochord and the ventral endoderm. (L) A DMSO-treated embryo sectioned at the fifth somite. Note the angioblasts at the midline and larger distance from the notochord to the ventral endoderm. (M) A DEAB embryo sectioned at the fifth somite. Note the lack of midline angioblasts and small distance between the notochord and the ventral endoderm. (N) A two-variable graph showing the percentage of angioblast fluorescence at the midline compared to the distance between the notochord and the ventral endoderm. Blue dots indicate DMSO-treated, 15-somite stage embryos sectioned at the 5th somite, and red squares are the same embryos sectioned at the 12th somite (N = 8). (O) A two-variable graph showing the percentage of angioblast fluorescence at the midline compared to the distance between the notochord and the ventral endoderm. Blue dots indicate DEAB-treated, 15-somite stage embryos sectioned at the 5th somite, and red squares are the same embryos sectioned at the 12th somite (N = 8). Scale bars, 50 µm.
|
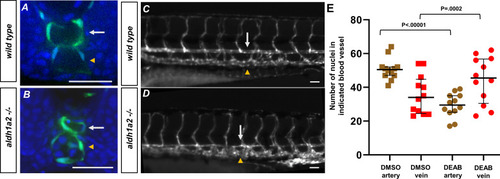
(A, B) A 24 hpf tg(kdrl:eGFP) embryo labeled with DAPI. (A) Wild-type embryos show lumenized blood vessels and normal-sized dorsal aorta. (B) Labeled aldh1a2-/-, tg(kdrl:eGFP) sibling shows small lumenized dorsal aorta with large posterior cardinal vein. (C) A 5 dpf tg(kdrl:eGFP) embryo. White arrows indicate the dorsal aorta, and yellow arrowheads indicate the cardinal vein. (D) A 5 dpf tg(kdrl:eGFP), aldh1a2-/- embryo. White arrows indicate reduced size of dorsal aorta. (E) Quantification of DMSO (n = 12) or 20 μM DEAB (n = 12)-treated tg(kdrl:nls-eGFP) embryos. Nuclei were counted in each structure over a 225 μM long transverse section of the zebrafish trunk. Two-tailed p-values for the unpaired t-test of wild-type vs. 20 μM DEAB-treated embryos are <0.00001 and 0.0002 for arteries and veins, respectively. Scale bars, 50 µm.
|
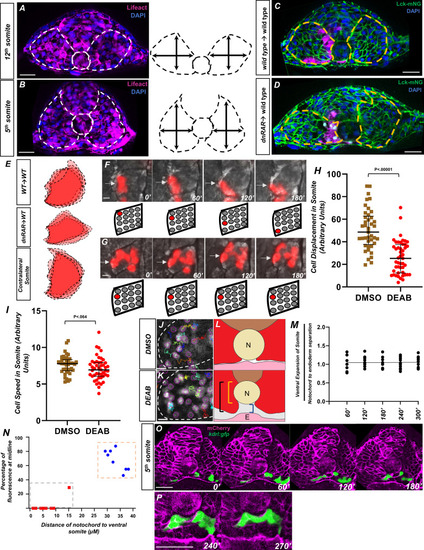
(A) Image and schematic of newly born 12th somite using tg(HS:lifeact), tg(kdrl:eGFP) embryo as reference. Dashed lines indicate the somite and notochord. (B) Schematic of more mature fifth somite (at the 12-somite stage) of tg(HS:lifeact), tg(kdrl:eGFP) embryo as reference. Dashed lines indicate somite and notochord. (C) Transplant of rhodamine dextran-labeled wild-type cells into tg(ubb:lck-mNG). Dashed lines indicate somite shape. (D) Transplant of tg(HS:dnRAR) cells into tg(ubb:lck-mNG). Dashed lines indicate somite shape. Note the immature shape of the somite containing transplanted cells. (E) Overlapping somite shapes of either WT→WT, tg(HS:dnRAR)→WT, or the contralateral somite tg(HS:dnRAR)→WT. (F, G) Time-lapse images of transplanted rhodamine dextran-labeled cells in DMSO and DEAB embryos at 12-somite stage. (F) DMSO-treated embryos over 180′. White arrows indicate labeled cells. (G) 20 μM DEAB-treated embryos over 180′. Scale bars, 50 μm. Retinoic acid-depleted embryos show little cellular movement during somite development. (H) Quantification of nuclei displacement in the second somite of DMSO and DEAB embryos over a 4 hr time period. Displacement is defined as the distance between the beginning location and end location of the nuclei within the somite 2. (I) Quantification of speed in somite 2, defined as average units over 4 hr in 10 min increments. (J) Sample of tracks from DMSO-treated tg(hsp70l:CAAX-mCherry-2A-NLS-KikGR) embryos. (K) Sample tracks of DEAB-treated tg(hsp70l:CAAX-mCherry-2A-NLS-KikGR) embryos. Tracks sort from red to blue, with red being the highest displacement. Scale bars, 20 µm (L) Diagram of ventral somite expansion and notochord to endoderm separation. Ventral somite expansion is calculated by ventral somite length (black bracket) – the notochord diameter (yellow bracket). Notochord/endoderm separation is shown in the blue bracket. (M) Quantification of the ventral expansion of the somite over notochord/endoderm separation in wild-type embryos. The linear regression indicated by the black line, where slope = 0.002, shows ventral somite expansion correlates with notochord/endoderm separation. (N) A two-variable graph showing the percentage of angioblast fluorescence at the midline compared to the distance of ventral somite expansion beneath the notochord. Blue dots indicate DMSO-treated, 15-somite stage embryos sectioned at the 5th somite, and red squares are the same embryos sectioned at the 12th somite (N = 8). Scale bars, 50 µm. (O) Live section of mCherry-CAAX-injected tg(kdrl:eGFP) embryos over 120′. Yellow arrowheads indicate the midline while white arrows indicate angioblasts. (P) Same live section as in (N), except at 240′ focused at the midline. Note the separation of the hypochord and endoderm prior to midline fusion of angioblasts. Scale bars, 50 µm.
|