
|
Figure 7
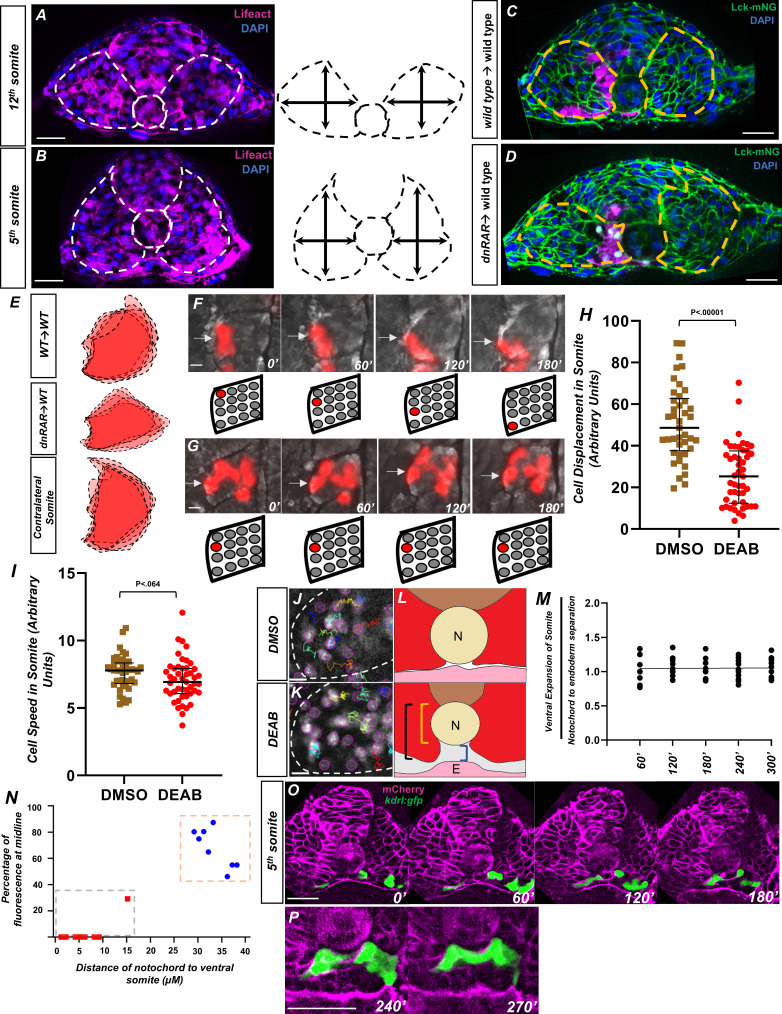
(A) Image and schematic of newly born 12th somite using tg(HS:lifeact), tg(kdrl:eGFP) embryo as reference. Dashed lines indicate the somite and notochord. (B) Schematic of more mature fifth somite (at the 12-somite stage) of tg(HS:lifeact), tg(kdrl:eGFP) embryo as reference. Dashed lines indicate somite and notochord. (C) Transplant of rhodamine dextran-labeled wild-type cells into tg(ubb:lck-mNG). Dashed lines indicate somite shape. (D) Transplant of tg(HS:dnRAR) cells into tg(ubb:lck-mNG). Dashed lines indicate somite shape. Note the immature shape of the somite containing transplanted cells. (E) Overlapping somite shapes of either WT→WT, tg(HS:dnRAR)→WT, or the contralateral somite tg(HS:dnRAR)→WT. (F, G) Time-lapse images of transplanted rhodamine dextran-labeled cells in DMSO and DEAB embryos at 12-somite stage. (F) DMSO-treated embryos over 180′. White arrows indicate labeled cells. (G) 20 μM DEAB-treated embryos over 180′. Scale bars, 50 μm. Retinoic acid-depleted embryos show little cellular movement during somite development. (H) Quantification of nuclei displacement in the second somite of DMSO and DEAB embryos over a 4 hr time period. Displacement is defined as the distance between the beginning location and end location of the nuclei within the somite 2. (I) Quantification of speed in somite 2, defined as average units over 4 hr in 10 min increments. (J) Sample of tracks from DMSO-treated tg(hsp70l:CAAX-mCherry-2A-NLS-KikGR) embryos. (K) Sample tracks of DEAB-treated tg(hsp70l:CAAX-mCherry-2A-NLS-KikGR) embryos. Tracks sort from red to blue, with red being the highest displacement. Scale bars, 20 µm (L) Diagram of ventral somite expansion and notochord to endoderm separation. Ventral somite expansion is calculated by ventral somite length (black bracket) – the notochord diameter (yellow bracket). Notochord/endoderm separation is shown in the blue bracket. (M) Quantification of the ventral expansion of the somite over notochord/endoderm separation in wild-type embryos. The linear regression indicated by the black line, where slope = 0.002, shows ventral somite expansion correlates with notochord/endoderm separation. (N) A two-variable graph showing the percentage of angioblast fluorescence at the midline compared to the distance of ventral somite expansion beneath the notochord. Blue dots indicate DMSO-treated, 15-somite stage embryos sectioned at the 5th somite, and red squares are the same embryos sectioned at the 12th somite (N = 8). Scale bars, 50 µm. (O) Live section of mCherry-CAAX-injected tg(kdrl:eGFP) embryos over 120′. Yellow arrowheads indicate the midline while white arrows indicate angioblasts. (P) Same live section as in (N), except at 240′ focused at the midline. Note the separation of the hypochord and endoderm prior to midline fusion of angioblasts. Scale bars, 50 µm.
Retinoic acid controls intrasomitic cellular movements and somite shape changes that contribute to angioblast convergence to the midline.