
Figure 2
- ID
- ZDB-FIG-220225-12
- Publication
- Paulissen et al., 2022 - Somite morphogenesis is required for axial blood vessel formation during zebrafish embryogenesis
- Other Figures
- All Figure Page
- Back to All Figure Page
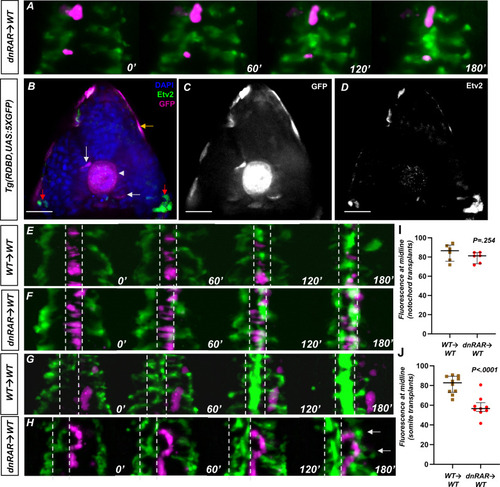
(A) Representative images of a time-lapse of tg(HS:dnRAR), tg(HS:id3) cells transplanted into a wild-type embryo. Cells labeled in magenta indicate migrating cells. These cells migrate along with the host angioblasts labeled by tg(kdrl:gfp), indicating normal migration patterns in the absence of cell-autonomous RA-depletion conditions (n = 3) (see Video 4). (B) DAPI-stained section of the 13-somite stage tg(RDBD,5XUAS:GFP) embryo, immunostained for GFP and Etv2 (n = 12). GFP signal is present in the adaxial region of the somite, the notochord, and the epidermis (white arrow, white arrowhead, and gold arrows, respectively). The red arrows indicate areas of Etv2 staining. (C) GFP channel of image in (B). (D) Etv2 channel of image in (B). Note the lack of overlap between Etv2 staining and GFP staining. (E) Representative images of a time-lapse of wild-type cells transplanted into a wild-type notochord. (F) Representative images of a time-lapse of tg(HS:dnRAR) cells transplanted into a wild-type notochord. (G) Representative images of a time-lapse of wild-type cells transplanted into a wild-type somite. (H) Representative images of a time-lapse of tg(HS:dnRAR) cells transplanted into a wild-type somite. White arrows indicate angioblast migration defects. (I) Quantification of midline fluorescence, as a percentage of total, for notochord transplants at 180′. The difference for wild-type and tg(HS:dnRAR) was not statistically significant (p=0.254). (J) Quantification of midline fluorescence, as a percentage of total, for somite transplants at 180′. The difference for wild-type and tg(HS:dnRAR) was statistically significant (p<0.0001). Scale bars, 50 µm.
|