
- Title
-
Zebrafish integrin a3b is required for cardiac contractility and cardiomyocyte proliferation
- Authors
- Yu, H.L., Hwang, S.L.
- Source
- Full text @ Biochem. Biophys. Res. Commun.
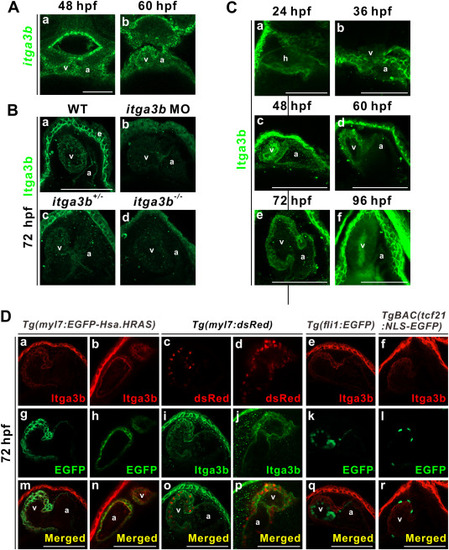
Fig. 1. Itga3b is expressed in the plasma membrane of cardiomyocytes. (A) itga3b is expressed in the ventricle and atrium of embryos at 48 and 60 hpf. Images of single confocal Z-stack are shown. (B) Membrane localization of Itga3b protein is observed in both the ventricle and atrium and the epidermis near the pericardium of wild-types (a) at 72 hpf. Low level of Itga3b protein is detected in the ventricle and atrium of itga3b morphants (b). Partial membrane localization of Itga3b protein is detected in the ventricle and atrium and the epidermis near the pericardium of itga3b+/- mutants (c). No expression of Itga3b protein is observed in the ventricle and atrium of itga3b−/− mutants (d). (C) Itga3b protein is expressed in the heart tube at 24 and 36 hpf and in the ventricle and atrium from 48 to 72 hpf, while a low level of Itga3b protein is observed in the ventricle and atrium at 96 hpf. Dorsal view (24 hpf) and ventral views (36–96 hpf) of embryos are shown. Respective 20 (a), 13 (c) or 5 (f) Z-stacks are shown. (D) Itga3b (red) is localized to the EGFP-expressing cardiomyocye plasma membrane of Tg(myl7:EGFP-Hsa. HRAS) transgenic embryos at 72 hpf. Itga3b protein (green) is observed in the cardiomyocyte plasma membrane surrounding nuclear dsRed (red) protein in Tg(myl7:dsRed) transgenic embryos. Itga3b (red) is not found in the EGFP-expressing endocardial cells of Tg(fli1:EGFP) or in the EGFP-expressing epicardial cells of TgBAC(tcf21:NLS-EGFP) transgenic embryos. Images of single confocal Z-stack are shown. a, atrium; e, epidermis; v, ventricle. Scale bar, 100 μm. (For interpretation of the references to colour in this figure legend, the reader is referred to the Web version of this article.) EXPRESSION / LABELING:
PHENOTYPE:
|
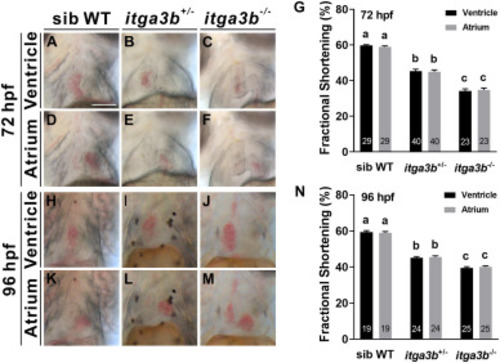
Fig. 2. itga3b mutant embryos display cardiac dysfunction. Respective bright-field images are shown of end-diastolic phase beating ventricle or atrium from sibling wild-type (WT) (A, D), itga3b+/- (B, E) or itga3b−/− (C, F) mutant embryos at 72 hpf. Fractional shortening (G) was decreased in itga3b+/- and itga3b−/− mutants compared with sibling wild-types at 72 hpf. Respective bright-field images are shown of end-diastolic phase beating ventricle or atrium from sibling wild-type (H, K), itga3b+/- (I, L) or itga3b−/− (J, M) mutants at 96 hpf. Fractional shortening (N) was decreased in itga3b+/- and itga3b−/− mutants compared with sibling wild-types at 96 hpf. Total number of embryos examined is indicated within each bar. Error bars indicate s.e.m. Quantitative data were analyzed by ANOVA with Tukey's multiple comparisons. Treatments that are not significantly different (α = 0.05) from each other are labeled with the same letter. Comparisons of fractional shortening between sib WT and itag3b+/- or itga3b−/− in ventricles or atria at 72 or 96 hpf all had p < 0.0001 (G, N). Scale bar, 100 μm. PHENOTYPE:
|
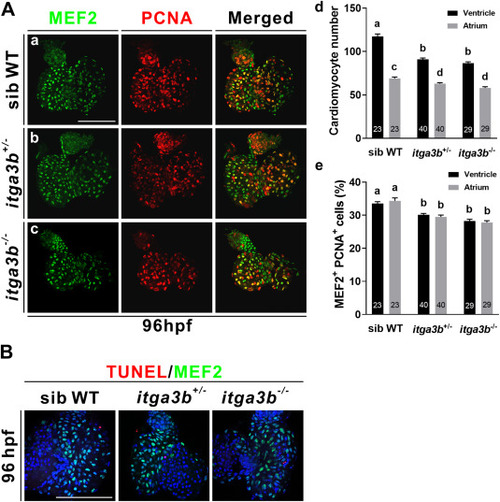
Fig. 3. itga3b mutant embryos exhibit impaired cardiomyocyte proliferation. (A) Immunostaining of MEF2 (green) or PCNA (red) in ventricles and atria of sibling wild-type (WT, a), itga3b+/- (b) and itga3b−/− (c) mutants at 96 hpf. Significantly decreased cardiomyocyte numbers (d) and percentages of MEF2+PCNA+ cardiomyocytes (e) were detected in ventricles and atria of itga3b+/- and itga3b−/− mutants compared to sibling wild-types. Total number of embryos examined is indicated within each bar. Error bars indicate s.e.m. Quantitative data were analyzed by ANOVA with Tukey's multiple comparisons. Treatments that are not significantly different (α = 0.05) from each other are labeled with the same letter. Comparisons of ventricular cardiomyocyte numbers between sib WT and itag3b+/- or itga3b−/− had p < 0.0001 and comparisons of atrial cardiomyocyte numbers between sib WT and itag3b+/- or itga3b−/− had p = 0.0085 and p < 0.0001, respectively (d). Comparisons of MEF2+PCNA+ cardiomyocytes between sib WT and itag3b+/- or itga3b−/− in ventricles or atria had p < 0.0001 (e). (B) Similar low levels of apoptotic cells in ventricular cardiomyocytes labeled with MEF2 (green) were detected by the TUNEL assay (red) in sibling wild-types, itga3b+/- and itga3b−/− mutants at 96 hpf. Scale bar, 100 μm. (For interpretation of the references to colour in this figure legend, the reader is referred to the Web version of this article.) PHENOTYPE:
|
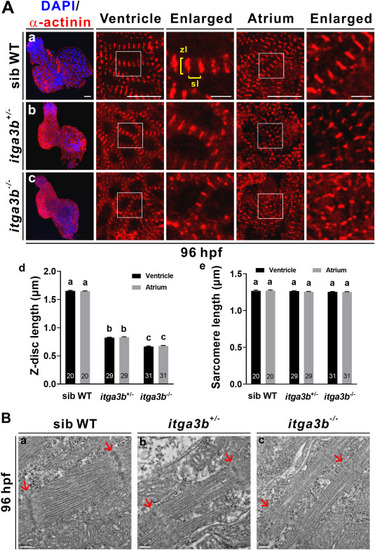
Fig. 4. itga3b mutant embryos display disorganized sarcomere structure. (A) α-actinin immunofluorescence shows striated Z-discs with reduced lengths in ventricles and atria of itga3b+/- (b) and itga3b−/− (c) mutants compared to sibling wild-types (WT, a) at 96 hpf. Enlarged images are indicated by the boxes in low magnification panels. Z-disc lengths (zl) and sarcomere lengths (sl) were measured from immunofluorescence images. Significantly decreased Z-disc length (d) but not sarcomere length (e) was observed in itga3b+/- and itga3b−/− mutants compared to sibling wild-types. Total number of embryos examined is indicated within each bar. Error bars indicate s.e.m. Quantitative data were analyzed by ANOVA with Tukey's multiple comparisons. Treatments that are not significantly different (α = 0.05) from each other are labeled with the same letter. Comparisons of Z-disc length between sib WT and itag3b+/- or itga3b−/− in ventricles or atria had p < 0.0001 (d). Scale bar, 25 μm. Scale bar for enlarged images, 5 μm. (B) Transmission electron microscopy shows thin myofibrils and indistinct Z-discs in ventricular sarcomere of itga3b+/- and itga3b−/− mutants compared to sibling wild-types at 96 hpf. Arrows indicate Z-disc. Scale bar, 200 nm. PHENOTYPE:
|