
|
Fig. 2
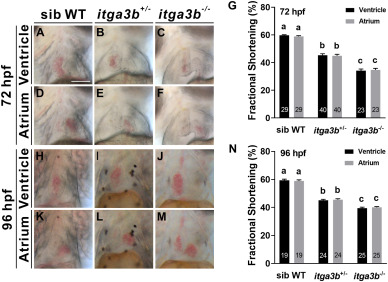
Fig. 2. itga3b mutant embryos display cardiac dysfunction. Respective bright-field images are shown of end-diastolic phase beating ventricle or atrium from sibling wild-type (WT) (A, D), itga3b+/- (B, E) or itga3b−/− (C, F) mutant embryos at 72 hpf. Fractional shortening (G) was decreased in itga3b+/- and itga3b−/− mutants compared with sibling wild-types at 72 hpf. Respective bright-field images are shown of end-diastolic phase beating ventricle or atrium from sibling wild-type (H, K), itga3b+/- (I, L) or itga3b−/− (J, M) mutants at 96 hpf. Fractional shortening (N) was decreased in itga3b+/- and itga3b−/− mutants compared with sibling wild-types at 96 hpf. Total number of embryos examined is indicated within each bar. Error bars indicate s.e.m. Quantitative data were analyzed by ANOVA with Tukey's multiple comparisons. Treatments that are not significantly different (α = 0.05) from each other are labeled with the same letter. Comparisons of fractional shortening between sib WT and itag3b+/- or itga3b−/− in ventricles or atria at 72 or 96 hpf all had p < 0.0001 (G, N). Scale bar, 100 μm.