
- Title
-
Heterogeneous pdgfrβ+ cells regulate coronary vessel development and revascularization during heart regeneration
- Authors
- Kapuria, S., Bai, H., Fierros, J., Huang, Y., Ma, F., Yoshida, T., Aguayo, A., Kok, F., Wiens, K.M., Yip, J.K., McCain, M.L., Pellegrini, M., Nagashima, M., Hitchcock, P.F., Mochizuki, N., Lawson, N.D., Harrison, M.M.R., Lien, C.L.
- Source
- Full text @ Development
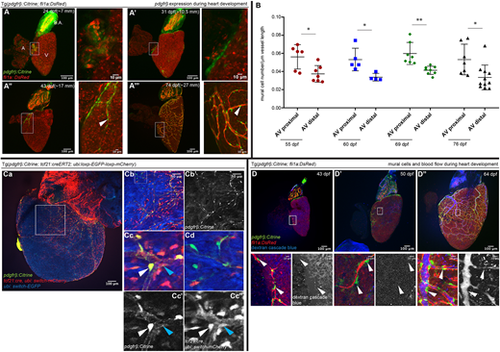
pdgfrb expression and mural cell origin in the developing zebrafish heart. (A-A‴) pdgfrb expression during heart development at 24 dpf (∼7 mm in body length; A), 31 dpf (∼10.5 mm in body length; A′), 43 dpf (∼17 mm in body length; A″) and 74 dpf (∼27 mm in body length; A‴). The boxed areas are enlarged in the images to the right. Green, pdgfrb:mCitrine; red, coronary endothelial cells marked by Tg(fli1a: DsRed). A, atrium; B.A. bulbus arteriosus; V, ventricle. n=5 hearts for each time point. (B) Quantification of pdgfrb+ mural cell association. Mural cell number per µm of the coronary vessels proximal or distal to the AVC at different time points (55, 60, 69 and 76) dpf. Boxes in A indicate the vessels quantified as proximal to AVC. n=5-7 hearts for each time point. Error bars represent s.d. *P≤0.05, **P≤0.01 (unpaired, two-tailed t-test). (C-C‴) tcf21+ lineage traced cells contribute to pdgfrb+ mural cells. (Ca) Representative image of a tcf21 lineage-traced fish at 87 dpf. ubi:switch-GFP (artificially colored blue) switches to ubi:switch-mCherry after recombination. pdgfrb:Citrine, green. (Cb-Cc) Enlarged views of the boxed areas in Ca and Cb. (Cc) tcf21 lineage-traced (mCherry) cells co-labeled with pdgfrb+ cells (white arrowhead) and pdgfrb− non-mural cell (blue arrowhead). Cc′ and Cc″ show single channels. (Cd) pdgfrb+ cells (green) that are negative for the tcf21 lineage. n=3. (D-D″) Mural cell association around the coronary vessels does not depend on blood flow. Coronary angiography (dextran, blue) was performed to monitor blood flow at 43 (D), 50 (D′) and 64 (D″) dpf. White arrowheads indicate pdgfrb+ mural cells in the images (enlarged views of the boxed areas above). n=5-6 hearts for each time point. EXPRESSION / LABELING:
PHENOTYPE:
|
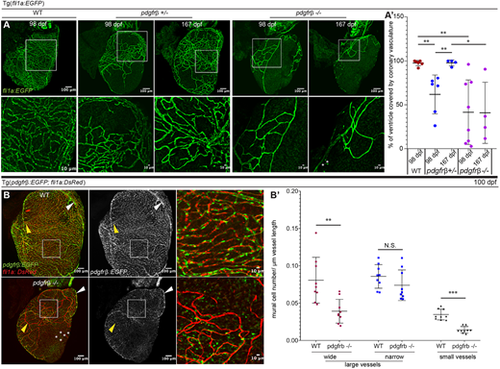
Pdgfrβ regulates mural cell number, association, and development of the coronary vessels. (A,A′) Coronary vessel coverage of the ventricle. (A) Imaging of fli1a:EGFP in WT (pdgfrb+/+), heterozygous (pdgfrb+/−) and homozygous (pdgfrb−/−) fish at 98 and 167 dpf. Asterisks indicate isolated endothelial cells. (A′) Quantification of coronary vessel coverage as a percentage of the ventricle area. pdgfrb+/− fish have decreased vessel coverage at 98 dpf (∼61.8%, n=6 fish) but this recovered by 167 dpf (∼97.85%, n=4 fish). pdgfrb−/− mutants have decreased vessel coverage at both 98 dpf (∼41.45%, n=8 fish) and 167 dpf (∼40.85%, n=4 fish) compared with WT (97.76%, n=7). Error bars represent s.d. *P≤0.05, **P≤0.01 (one-way ANOVA). (B,B′) Mural cell association with different types of coronary vessels is affected differently in the pdgfrb−/− mutant. (B) Mural cell [Tg(pdgfrb:EGFP)] association with the small coronary vessels/capillaries [Tg(fli1a:DsRed)] is decreased at 100 dpf in pdgfrb−/− mutant heart. Mural cells are maintained around narrow, large (artery-like) vessels (white arrowheads), but the wider, large (vein-like) vessels (yellow arrowheads) lack mural cells. Asterisks indicate isolated endothelial cells. (B′) Quantification of mural cell recruitment on large and small coronary vessels. Mural cell number per µm vessel length on the narrow, large vessels is not significantly different between pdgfrb+/+ and pdgfrb−/−. Mural cell recruitment on the wide, large vessels and small coronary vessels is significantly decreased in pdgfrb−/− heart ventricles. n=3 vessels from each of 3-5 heart ventricles of pdgfrb+/+ and pdgfrb−/− fish. Error bars represent s.d. **P≤0.01, ***P≤0.001 (paired, two-tailed t-test). N.S., not significant (P>0.05). |
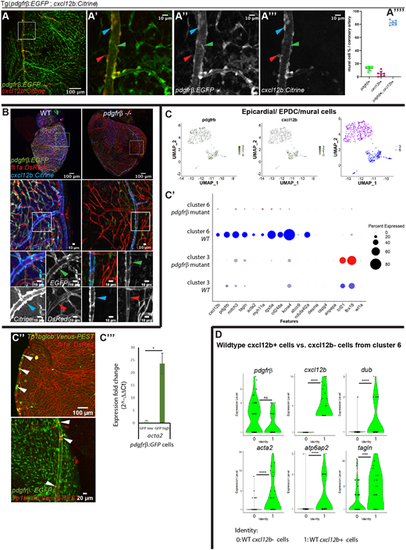
pdgfrb+;cxcl12b+ arterial mural cells are smooth muscle-like and they remain associated with endothelial cells in the pdgfrb mutant. (A-A″″) The majority of the pdgfrb+ mural cells express cxcl12b on the large, narrow vessels (coronary artery). (A-A‴). On the main trunk of the coronary artery, most pdgfrb:EGFP+ mural cells (green) express cxcl12b:Citrine (blue arrowheads). A few mural cells only express pdgfrb (green arrowheads) or cxcl12b (red arrowheads). cxcl12b expression in the pdgfrb+ mural cells gradually decrease on the branches away from the main coronary artery (A‴). A′-A‴ show enlarged views of the boxed area in A. (A″″) Quantification of pdgfrb+;cxcl12b+ (∼82.4% of the mural cells on the coronary artery), pdgfrb+ only (∼12.9%) and cxcl12b+ only (∼4.7%) mural cells (n=5 hearts, 1-2 coronary arteries in each heart, 20× confocal images used for quantification). (B) In pdgfrb−/−, pdgfrb:EGFP- and cxcl12b:Citrine-expressing mural cells remain associated with the coronary artery whereas other vessels lose mural cell association. Boxed areas are enlarged and shown as single-channel images beneath. (C-C‴) Differentially expressed genes between pdgfrb mutant and WT in cluster 3 (EPDC) and cluster 6 (mural cell). (C) FACS-isolated pdgfrb:EGFP+ EPDCs and mural cells form two distinct clusters. The UMAP plot shows that cells in both clusters express pdgfrb and only one cluster expresses cxcl12b. (C′) Dot plot showing differentially expressed smooth muscle cell (tagln, acta2, myh11a), mural cell (pdgfrb, notch3 rgs5a, cd248a, kcne4, ndufa4l2a), epicardial (tcf21, tbx18) and cxcl12 genes in cluster 3 and cluster 6 of pdgfrb mutant and WT. Differentially expressed genes were determined with minimum percentage expression cut-off=0.1 and minimum average log fold change=0.25, adjusted P-value≤0.001 comparing cluster 6 versus cluster 3 and P-value≤0.05 for pdgfrb, notch3, tagln, rgs5a, cd248a and kcne4 comparing pdgfrb mutants and WT. (C″) Notch activities in coronary arterial mural cells, reflecting nocth3 expression (white arrowheads). (C‴) qRT-PCR of acta2 in GFP high (pdgfrb+; cxcl12b+) versus GFP low (pdgfrb+ only) cells. *P≤0.05 [one-sample (one-tailed) t-test]. (D) Violin plots of differentially expressed genes in WT cxcl12b+ cells compared with cxcl12b− cells of cluster 6. 0=WT cxcl12b− cells, 1=WT cxcl12b+ cells (average log fold change>0.8 except for pdgfrb+). ***P≤0.001, ****P≤0.0001 (non-parametric Wilcoxon rank sum test). N.S., not significant (P>0.05). |
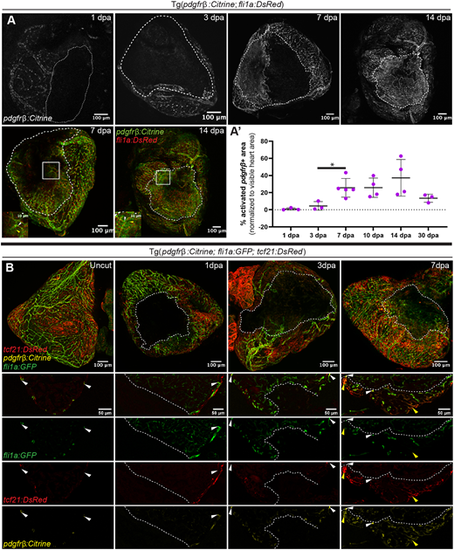
Dynamic pdgfrb expression in the injured area during regeneration. (A,A′) pdgfrb expression early during heart regeneration. (A) Tg(pdgfrb:Citrine; fli1a:DsRed) fish hearts at 1, 3, 7 and 14 dpa. White dashed line indicates the injured area. White dotted line indicates the pdgfrb-expressing area. In the insets, white arrowheads indicate pdgfrb expression in mural cells and the yellow arrowheads non-mural cell pdgfrb expression. (A′) Quantification of the pdgfrb+ area as a percentage of the imaged heart area. Error bars represent s.d. *P≤0.05 (one-way ANOVA). 1 day, 3 days, 30 days: n=3; 7 days: n=5; 10 days, 14 days: n=4. (B) pdgfrb expression in epicardium. Tg(pdgfrb:Citrine; fli1a:EGFP; tcf21:DsRed) fish hearts imaged as whole-mount preparations and as sections in uncut, 1, 3 and 7 dpa fish. White arrowheads indicate pdgfrb expression in mural cells; yellow arrowheads non-mural cell pdgfrb expression. |
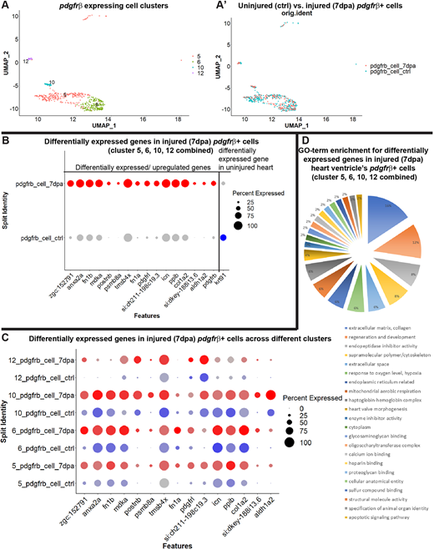
Characterization of the pdgfrb+ cells in regenerating hearts after amputation. (A,A′) The epicardial/EPDC and mural cell clusters (5, 6, 10 and 12) of FACS-sorted pdgfrb:EGFP+ from uninjured and injured (7 dpa) fish hearts. (A) UMAP plot of integrated uninjured and 7 dpa epicardial/EPDC and mural cells. (A′) UMAP plot of cells from uninjured (blue) and 7 dpa (red) hearts. (B) Dot plot of the differentially expressed genes in FACS-sorted pdgfrb:EGFP-expressing cells analyzed by combining clusters 5, 6, 10 and 12. Blue dot, represents uninjured hearts. Red dots represent 7 dpa hearts. Expression level across cells within the cluster is shown by intensity of the color and the percentage of the cells expressing the marker gene is shown by the size of the dot (0-100%). Differentially expressed genes were determined with minimum percent expression cut-off=0.1 and minimum average log fold change=0.25, adjusted P≤0.001. (C) Dot plot of the differentially expressed genes in FACS-sorted pdgfrb:EGFP-expressing cells in clusters 5, 6, 10 and 12. (D) Categorizations and relative enrichments of GO terms derived from the differentially expressed genes in the combined clusters 5, 6, 10 and 12. Genes are selected with adjusted P-value≤0.1 and enriched GO terms were selected with Holm–Bonferroni correction P≤0.05. |
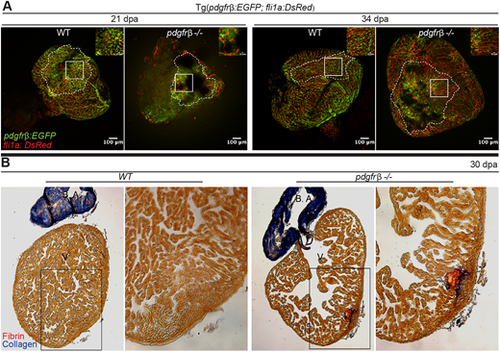
pdgfrb mutant hearts fail to regenerate and form a fibrotic scar. (A) pdgfrb mutant fish cannot revascularize the regenerating area of the amputated heart. pdgfrb+/+ fish have dense network of coronary vasculature (pdgfrb:EGFP, green; fli1a:DsRed, red) in the regenerating area at 21 and 34 dpa whereas the pdgfrb mutants have very few coronary vessels with network formation. Unlike WT, the coronary vessels in the pdgfrb mutant lack the pdgfrb+ mural cell coverage in the regenerating area (n=4). (B) Acid Fuchsin Orange G staining of heart sections of WT and pdgfrb mutants at 30 dpa. n=7. Images to the right show enlarged views of the boxed areas to the left. B.A. bulbus arteriosus; V, ventricle. PHENOTYPE:
|