
- Title
-
Functional Verification of Novel ELMO1 Variants by Live Imaging in Zebrafish
- Authors
- Xue, R., Wang, Y., Wang, T., Lyu, M., Mo, G., Fan, X., Li, J., Yen, K., Yu, S., Liu, Q., Xu, J.
- Source
- Full text @ Front Cell Dev Biol

ZFIN is incorporating published figure images and captions as part of an ongoing project. Figures from some publications have not yet been curated, or are not available for display because of copyright restrictions. EXPRESSION / LABELING:
|
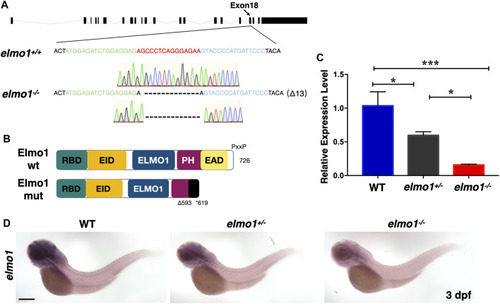
The establishment of the zebrafish elmo1 mutant. (A) Schematic representation of the elmo1 genomic locus (NC_007130.7). The extended region on exon 18 represents the sequence targeted by the TALEN system. Green: left TALEN arm binding site. Blue: right TALEN arm binding site. Red: spacer site. elmo1+/+ corresponds to the wild-type allele while elmo1−/− represents the loss of function allele in this study. Dashes represent the 13 base pair deletion. (B) Schematic view of the wild-type Elmo1 protein (Elmo1 wt) and the mutated Elmo1 protein (Elmo1 mut). The 726 amino acid (aa) Elmo1 wt contains five conserved domains (NP_998,256), while the Elmo1 mut resulting in a truncated protein end up at 619 aa. RBD: RhoG-binding domain; EID: ELMO inhibitory domain; ELMO1: ELMO1 domain; PH: pleckstrin homology; EAD: ELMO auto-regulatory domain. (C) The qRT-PCR result showed the relative expression level of the elmo1 gene in the offsprings of heterozygous intercross at 3 dpf. Three independent experiments were performed. One-way ANOVA, *p < 0.05, ***p < 0.005. (D) elmo1 expression pattern detected by WISH in the offsprings of heterozygous intercross at 3 dpf. Scale bar: 200 μm. EXPRESSION / LABELING:
PHENOTYPE:
|
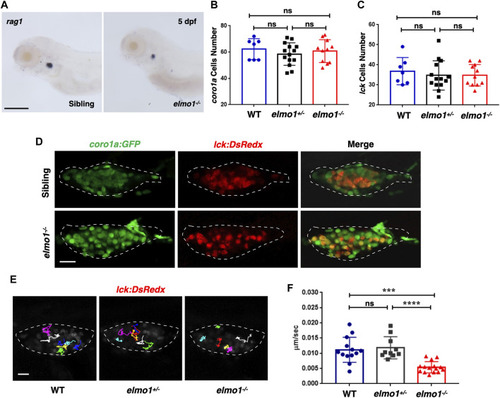
T-cell motility in the thymus was reduced at the larval stage of the elmo1 mutant. (A) rag1 WISH data indicate a T-cell defect in the elmo1−/− larvae at 5 dpf. Scale bar: 200 μm. (B, C) Quantification of coro1a:GFP positive cells (B) represents whole leukocytes and lck:DsRedx positive (C) cells represent T-cells within the thymus in the wild-type (WT), elmo1+/−, elmo1−/− larvae respectively. There was no significance between them. One-way ANOVA, ns: no significance. (D) Fluorescence images show that coro1a:GFP represent whole leukocytes and lck:DsRedx represent T-cells show no significance between the siblings and elmo1−/− larvae in the thymus at 5 dpf. The white dotted region indicates the thymus in the image. Scale bar: 10 μm. (E) Track path of lck:DsRedx labeled T-cells of the WT, elmo1+/− and elmo1−/− larvae recorded by live imaging at 5 dpf. The white dotted region indicates the thymus. Each line represents the migration path of one T-cell. Scale bar: 10 μm. (F) Quantification of T-cells migration speed in live imaging of the WT (13 cells of 4 larvae), elmo1+/− (10 cells of 4 larvae) and elmo1−/− (15 cells of 5 larvae) larvae in the thymus at 5 dpf. The migration speed of T-cells dramatically decreased in the elmo1−/− larvae. Each dot represents the average speed of one T-cell. Three independent experiments were performed. One-way ANOVA, ns: no significance, ***p < 0.005, ****p < 0.001. |
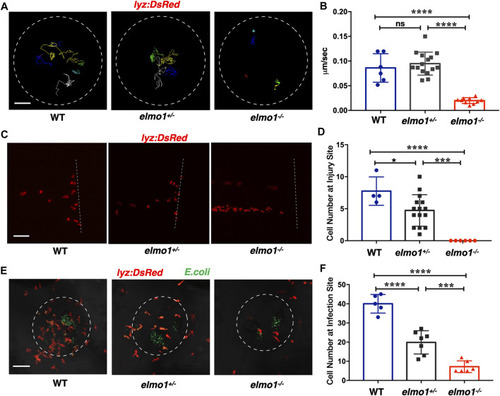
Neutrophils showed attenuated motility and impaired chemotaxis to injury/infection in the elmo1 mutant. (A) Track path of lyz:DsRed labeled neutrophils of the WT, elmo1+/− and elmo1−/− larvae on the yolk sac recorded by live imaging at 3 dpf. The white dotted circle indicates the imaging region of the yolk sac. Each line represents the migration path of individual cells. Scale bar: 50 μm. (B) Quantification of neutrophils migration speed of the WT (6 cells of 3 larvae), elmo1+/− (15 cells of 5 larvae), and elmo1−/− (10 cells of 5 larvae). The elmo1−/− showed dramatically decreased speed compared with the WT and elmo1+/−. (C) Fluorescent image of tail fin transection of the WT, elmo1+/− and elmo1−/− larvae at 3 dpf. The larvae tail region was imaged and the white dotted line represents the transection site. lyz:DsRed represents neutrophils failed to accumulate to the injury site in the elmo1−/− compared with the WT and elmo1+/−. Scale bar: 50 μm. (D) Quantification of neutrophils accumulated at the tail fin transection site. Neutrophils of the elmo1−/− larvae failed to respond to injury compared with the WT and elmo1+/−. (E) Fluorescent image of bacterial infection in the otic vesicle of WT, elmo1+/− and elmo1−/− larvae at 3 dpf. The white dotted circle represents the infection region. Bacteria of E.coli were labeled by GFP. lyz:DsRed labeled neutrophils showed a decreasing number at the infection region in the elmo1−/− compared with the WT and elmo1+/−. Scale bar: 50 μm. (F) Quantification of lyz:DsRed labeled neutrophils accumulated at the infection region. Neutrophils of the elmo1−/− larvae failed to respond to infection compared with the WT and elmo1+/−. In quantification results, each dot represents the neutrophil number in the infected region in individual larvae. Three independent experiments were performed. Here presents one result of three experiments. One-way ANOVA, ns: no significance, *p < 0.05, ***p < 0.005, ****p < 0.001. (B, C, F). EXPRESSION / LABELING:
PHENOTYPE:
|
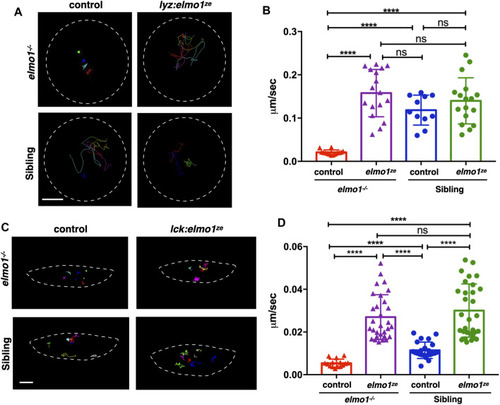
The elmo1 was cell-autonomously required for the motility of leukocytes in zebrafish larvae. (A) Track path of neutrophils expressing lyz:GFP (control) or lyz:elmo1ze-GFP (lyz:elmo1ze) on the yolk sac in the elmo1−/− and sibling larvae recorded by live imaging at 3 dpf. Each line represents the migration path of a single cell recorded by live imaging. Scale bar: 50 μm. (B) Quantification of the neutrophils migration speed of the control and elmo1ze group in elmo1−/− (14 cells of 4 larvae, 17 cells of 6 larvae) and sibling (11 cells of 4 larvae, 17 cells of 6 larvae) larvae. Compared with the control group, the migration speed of neutrophils expressing lyz:elmo1ze was significantly increased in the elmo1−/− larvae. Each dot represents the average speed of one individual cell. Three independent experiments were performed. Here present the summarized results of three experiments. One-way ANOVA, ns: no significance, ****p < 0.001. (C) Track path of T-cells expressing lck:DsRedx (control) or lck:elmo1ze-GFP (lck:elmo1ze) within the thymus in elmo1−/− and sibling larvae recorded by live imaging at 5 dpf. Each line represents the migration path of a single cell recorded by live imaging. Scale bar: 10 μm. (D) Quantification of the T-cells migration speed of control and elmo1ze group in elmo1−/− (15 cells of 4 larvae, 30 cells of 9 larvae) and sibling (22 cells of 4 larvae, 31 cells of 9 larvae) larvae. Compared with the control group, the migration speed of T-cells expressing lck:elmo1ze was significantly increased in the elmo1−/− larvae. Each dot represents the average speed of one individual cell. Three independent experiments were performed. Here present the summarized results of three experiments. One-way ANOVA, ns: no significance, ****p < 0.001. PHENOTYPE:
|
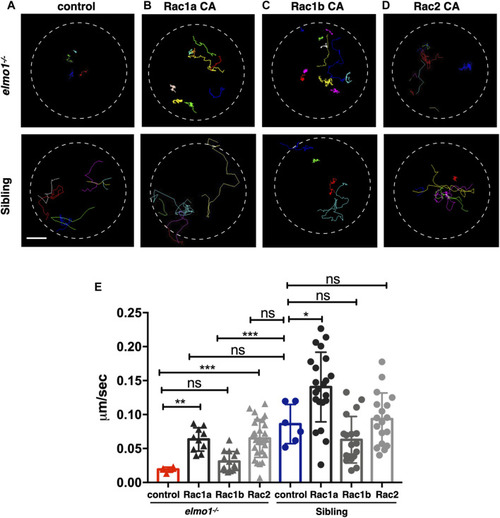
Constitutively activated Rac rescued the neutrophil motility deficiency of the elmo1 mutant. (A) Track path of neutrophils expressing lyz:GFP in the elmo1−/− and sibling larvae recorded by live imaging at 3 dpf. (B–D) Track path of neutrophils expressing constitutively activated Racs (Racs CA) in the elmo1−/− and sibling larvae recorded by live imaging at 3 dpf. (B) Rac1a CA, (C) Rac1b CA, (D) Rac2 CA. Each line represents the migration path of individual cells. (A–D) Scale bar: 50 μm. (E) Quantification of the migration speed of control and neutrophils expressing constitutively activated Racs in the elmo1−/− (6 cells of 3 larvae, 10 cells of 6 larvae, 13 cells of 6 larvae, 25 cells of 6 larvae) and sibling (6 cells of 3 larvae, 22 cells of 6 larvae, 18 cells of 6 larvae, 18 cells of 6 larvae) larvae. Compared with the control group, the migration speed of neutrophils expressing Rac1a CA (Rac1a) and Rac2 CA (Rac2) were significantly increased. Neutrophils expressing Rac1a CA (Rac1a) also show an increased the migration speed in sibling. Each dot represents the speed of individual cells. Three independent experiments were performed. Here present the summarized results of three experiments. One-way ANOVA, ns: no significance, *p < 0.05, **p < 0.01, ***p < 0.005, ****p < 0.001. PHENOTYPE:
|
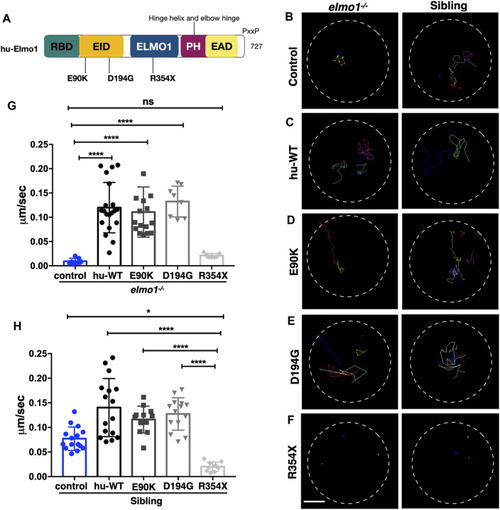
The zebrafish elmo1 mutant can serve as an in vivo model to verify the functions of human variants. (A) Schematic view of human ELMO1 protein conserved domains. Position of tested variants: p.E90K (E90K), p.D194G (D194G), and p.R354X (R354X) are indicated. (B–F) Track path of neutrophils expressing lyz:GFP control (B) or human ELMO1 (C–F) in the elmo1−/− and siblings recorded by live imaging at 3 dpf. Human wild-type (hu-WT) form (C), E90K (D), D194G (E), R354X (F). (G, H) Quantification of the migration speed of the control group and neutrophils expressing human ELMO1 variants in the elmo1−/− (7 cells of 3 larvae, 20 cells of 6 larvae, 16 cells of 6 larvae, 8 cells of 6 larvae, 7 cells of 3 larvae) (G) and sibling (15 cells of 3 larvae, 16 cells of 7 larvae, 12 cells of 8 larvae, 14 cells of 7 larvae, 10 cells of 5 larvae). (H). hu-WT, E90K, and D194G could efficiently rescue the migration speed in the elmo1 mutant compared with control. R354X failed to rescue the defects in elmo1−/− and even show a decreased migration speed in siblings. One-way ANOVA, ns: no significance, *p < 0.05, ****p < 0.001. Scale bar: 50 μm (B–F). PHENOTYPE:
|