
|
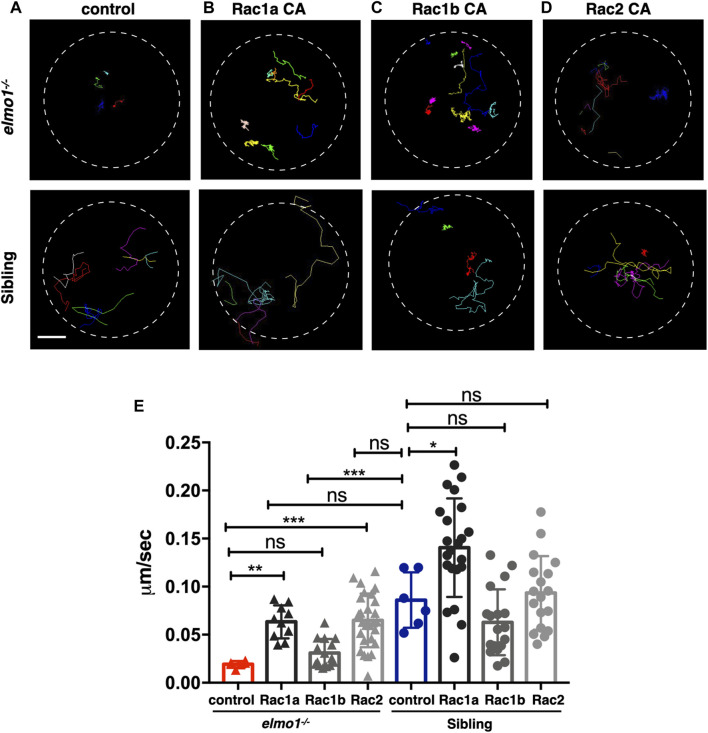
FIGURE 5 Constitutively activated Rac rescued the neutrophil motility deficiency of the elmo1 mutant. (A) Track path of neutrophils expressing lyz:GFP in the elmo1−/− and sibling larvae recorded by live imaging at 3 dpf. (B–D) Track path of neutrophils expressing constitutively activated Racs (Racs CA) in the elmo1−/− and sibling larvae recorded by live imaging at 3 dpf. (B) Rac1a CA, (C) Rac1b CA, (D) Rac2 CA. Each line represents the migration path of individual cells. (A–D) Scale bar: 50 μm. (E) Quantification of the migration speed of control and neutrophils expressing constitutively activated Racs in the elmo1−/− (6 cells of 3 larvae, 10 cells of 6 larvae, 13 cells of 6 larvae, 25 cells of 6 larvae) and sibling (6 cells of 3 larvae, 22 cells of 6 larvae, 18 cells of 6 larvae, 18 cells of 6 larvae) larvae. Compared with the control group, the migration speed of neutrophils expressing Rac1a CA (Rac1a) and Rac2 CA (Rac2) were significantly increased. Neutrophils expressing Rac1a CA (Rac1a) also show an increased the migration speed in sibling. Each dot represents the speed of individual cells. Three independent experiments were performed. Here present the summarized results of three experiments. One-way ANOVA, ns: no significance, *p < 0.05, **p < 0.01, ***p < 0.005, ****p < 0.001.