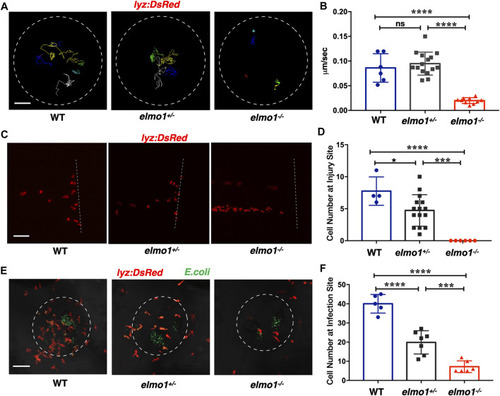
Neutrophils showed attenuated motility and impaired chemotaxis to injury/infection in the elmo1 mutant. (A) Track path of lyz:DsRed labeled neutrophils of the WT, elmo1+/− and elmo1−/− larvae on the yolk sac recorded by live imaging at 3 dpf. The white dotted circle indicates the imaging region of the yolk sac. Each line represents the migration path of individual cells. Scale bar: 50 μm. (B) Quantification of neutrophils migration speed of the WT (6 cells of 3 larvae), elmo1+/− (15 cells of 5 larvae), and elmo1−/− (10 cells of 5 larvae). The elmo1−/− showed dramatically decreased speed compared with the WT and elmo1+/−. (C) Fluorescent image of tail fin transection of the WT, elmo1+/− and elmo1−/− larvae at 3 dpf. The larvae tail region was imaged and the white dotted line represents the transection site. lyz:DsRed represents neutrophils failed to accumulate to the injury site in the elmo1−/− compared with the WT and elmo1+/−. Scale bar: 50 μm. (D) Quantification of neutrophils accumulated at the tail fin transection site. Neutrophils of the elmo1−/− larvae failed to respond to injury compared with the WT and elmo1+/−. (E) Fluorescent image of bacterial infection in the otic vesicle of WT, elmo1+/− and elmo1−/− larvae at 3 dpf. The white dotted circle represents the infection region. Bacteria of E.coli were labeled by GFP. lyz:DsRed labeled neutrophils showed a decreasing number at the infection region in the elmo1−/− compared with the WT and elmo1+/−. Scale bar: 50 μm. (F) Quantification of lyz:DsRed labeled neutrophils accumulated at the infection region. Neutrophils of the elmo1−/− larvae failed to respond to infection compared with the WT and elmo1+/−. In quantification results, each dot represents the neutrophil number in the infected region in individual larvae. Three independent experiments were performed. Here presents one result of three experiments. One-way ANOVA, ns: no significance, *p < 0.05, ***p < 0.005, ****p < 0.001. (B, C, F).
|
