
- Title
-
Environmental and Molecular Modulation of Motor Individuality in Larval Zebrafish
- Authors
- Hageter, J., Waalkes, M., Starkey, J., Copeland, H., Price, H., Bays, L., Showman, C., Laverty, S., Bergeron, S.A., Horstick, E.J.
- Source
- Full text @ Front. Behav. Neurosci.
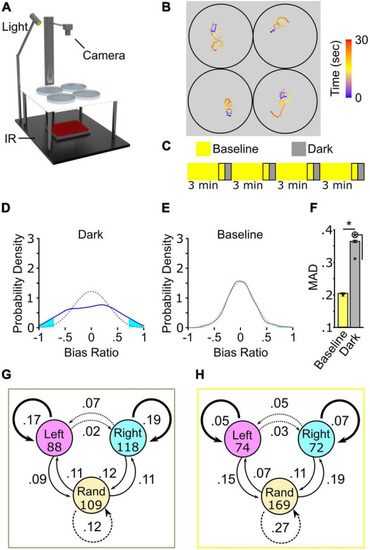
Turning behavior following the loss of light exhibits high inter-individual variation. (A) Schematic of multiplex recording rig. (B) Illustrative path trajectories following loss of light from multiplex recording. Color scale is time (seconds). (C) Diagram of 4× recording. Outlined regions denote recording intervals. (D–F) 4× recordings strategy to show high inter-individual variation in turn bias. (D) Average bias ratio probability density curve for dark responses (solid blue line, N = 374) and paired curve following reshuffling (dotted blue line, average of 1,000 resampled datasets). (E) Same as (D) except the paired baseline responses (solid gray line, N = 374) and random permutation density curve (dotted gray line). Cyan fill shows the area in each tail corresponding to the probability of observing a result more extreme or equal to ±0.3 average bias ratio. (F) MAD for baseline (yellow), and dark (gray) responses. N = 374. Error bars are 95% confidence intervals generated by bootstrap resampling. Asterisk in circle, p < 0.05 to MAD permutation value shown with an X. (G) Dark responses (gray outline) and baseline (H) (yellow outline) from 4× recording showing frequency of direction change between first (circles) and second (arrows) pairs of responses. Initial N shown in circles. Bold, solid, and dotted arrows delineate responses that produce perfectly matched bias, partial bias, and unbiased responses, respectively. |
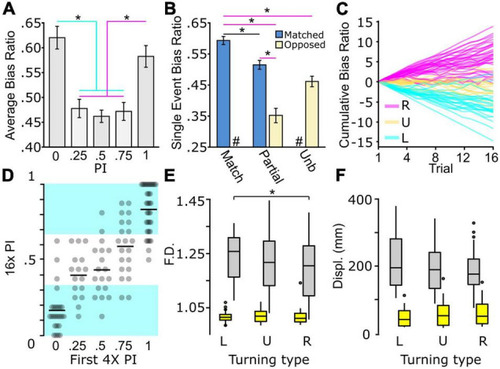
Biased and unbiased motor types present during light-search. |
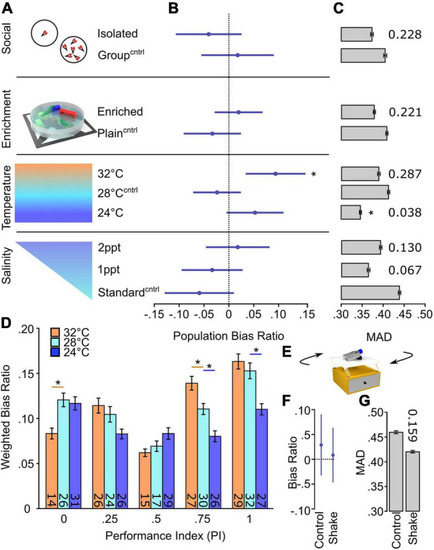
Temperature selectively changes inter-individual variation in turn bias. (A) Schematic of environmental manipulations (Social Isolated N = 87, Social Group N = 87; Enriched N = 172, Plain N = 134; Temp. 32°C N = 112, Temp. 28°C N = 136, Temp. 24°C N = 144; Standard salinity N = 102, 1 ppt N = 107, 2 ppt N = 107). Each condition has an independent control denoted by superscript Cntrl. (B) Average bias ratios across the entire tested population per condition. Statistical comparison performed to 0, denoting no population level bias. (C) MAD for dark responses, error bars are 95% confidence levels generated from 1,000 bootstraps. Individual p-values shown above bars, calculated by comparing experimental groups to controls. (D) Average bias ratio per PI weighted by the percent of individuals. N’s indicated within bars. (E) Representative diagram of the setup used to shake larvae during early development. Average population bias ratio (F) and MAD (G) between shake experiments. Number above bar represents p-value compared to the control group. Asterisk p < 0.05. |
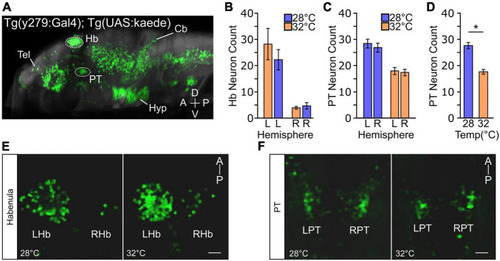
Temperature impacts y279 specified expression in the PT. (A) Single sagittal slice of larval zebrafish brain showing expression of enhancer trap Tg(y279:Gal4) obtained from the ‘Zebrafish Brain Browser’ atlas. Circled regions highlight the habenula (Hb) and rostral posterior tuberculum (PT) and white lines show the telencephalon (Tel), hypothalamus (Hyp), and cerebellum (Cb). (B–F) Effect of elevated temperature during early development on the expression of y279 in the habenula and PT. (B) Expression of y279 in the left and right hemisphere Hb nuclei (28°C purple, N = 16; 32°C orange, N = 14). (C) y279 positive PT neurons (28°C purple, N = 16; 32°C orange, N = 14). (D) Combined left and right hemisphere PT neuron counts (28°C purple, N = 16; 32°C orange, N = 14). (E,F) Representative images showing maximum intensity projections for y279 positive Hb (left habenula, LHb; right habenula, RHb) (E) and PT (left PT, LPT; right PT, RPT) (F) neurons for larvae raised at 28 or 32°C. Scale bar 20 μm. Asterisk p < 0.05. |
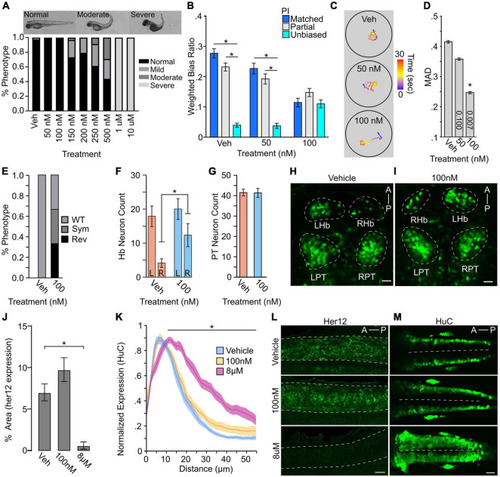
Turn bias is sensitive to levels of Notch signaling. (A) Phenotypic counts following Notch inhibitor treatment (Vehicle, N = 125; 50 nM, N = 88; 100 nM, N = 114; 150 nM, N = 123; 200 nM, N = 120; 250 nM, N = 101; 500 nM, N = 48; 1 μM, N = 43; 10 μM, N = 100). (B) Weighted absolute bias ratio averages (matched PI = 0,1 blue bar; Partial match PI = 0.25, 0.75 gray bar; unbiased PI = 0.50 cyan bar. (C) Illustrative traces for treatment groups. Scale bar color represents time in seconds. (D) Effect of Notch inhibition on MAD. p-values shown in bar, 1-way comparison of treatment groups to control. (E) Habenula symmetry for vehicle controls (N = 8) and 100 nM Notch inhibitor treated (N = 9) larvae showing proportion with WT, symmetric (Sym), or reversed (Rev) phenotypes. WT larvae have the larger habenula in the left hemisphere. y279 neuron counts in the habenula (F: vehicle N = 8; 100 nM N = 9) and PT (G: vehicle N = 8; 100 nM N = 9). For neuron counts, regardless of hemisphere the larger habenula was classified as the ‘left’ habenula. (H,I) Representative maximum projection images showing y279 labeled neurons in vehicle and control. Scale bar 20 μm. (J) Area of her12 expression in the spinal cord following LY411575 treatment (Vehicle, N = 12; 100 nM, N = 13; 8 μM, N = 11). (K) Normalized distribution of HuC/D positive neurons following notch inhibition (Vehicle: Blue, N = 18; 100 nM: Yellow, N = 13; 8 μM: Magenta, N = 13). X-axis distance spans half the spinal cord (0 micron = lateral spinal cord; 55 micron = spinal cord midline). Comparison shown is between vehicle and 8 μM along the whole length of black bar between matched positions. Ribbons ± SEM. (L) Representative images of her12 expression in 27 hpf embryos. Lateral view of spinal cord (dotted outline). Scale bar 20 μm. (M) Representative HuC labeling in 24 hpf embryos showing dorsal view. Dotted line denotes spinal cord midline. Scale Bar 40 μm. Asterisk p < 0.05. |
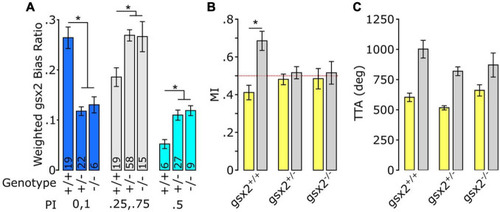
Loss of gsx2 reduces inter-individual variation. (A) Effect of gsx2 genotype on weighted average bias ratio per performance groups (Matched: PI = 0,1; Partial PI = 0.25,0.75; and Unbiased PI = 0.5). Numbers on bars indicate N. Weighing was based on the percent of larvae within each PI per genotype. (B) MI shows that only gsx2+/+larvae maintain persistent same-direction turning following the loss of illumination. Dotted line at 0.5 indicates random movement. (C) TTA between genotypes is not affected (gsx2+/+, N = 45; gsx2±, N = 113; gsx2–/–, N = 32). Baseline (yellow) and dark (gray) responses in (B,C). Asterisk p < 0.05. |
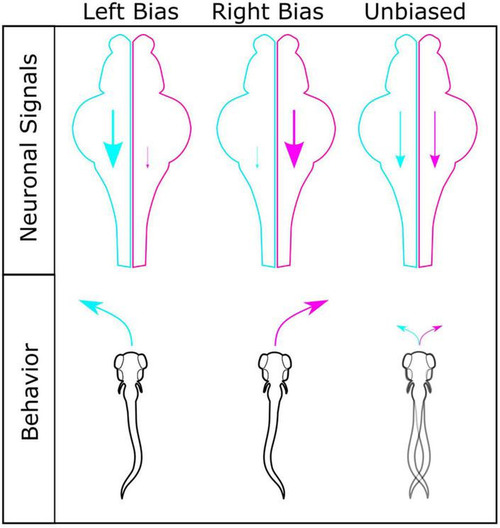
Model for generating different turning types. Interhemispheric differences in turn bias driving motor signals are a potential mechanism for establishing turning types. Left (cyan) and right (magenta) hemispheres shown for left, right, and unbiased motor types, with corresponding motor drive shown by scale of descending arrow. For individuals with robust left or right turning types, a strong ipsilateral turn bias signal persists in a single hemisphere, with limited conflicting input from the contralateral hemisphere. In individuals with similar turn bias drive from both hemispheres, no single turn direction persists due to conflict between hemispheres, resulting in lower bias ratios and unbiased turning types. |