
FIGURE 5
- ID
- ZDB-FIG-211230-27
- Publication
- Hageter et al., 2021 - Environmental and Molecular Modulation of Motor Individuality in Larval Zebrafish
- Other Figures
- All Figure Page
- Back to All Figure Page
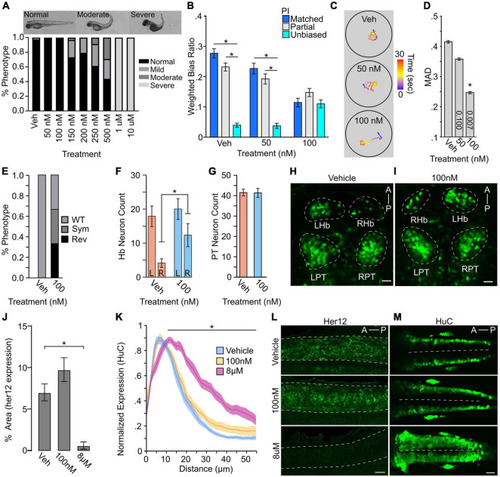
Turn bias is sensitive to levels of Notch signaling. (A) Phenotypic counts following Notch inhibitor treatment (Vehicle, N = 125; 50 nM, N = 88; 100 nM, N = 114; 150 nM, N = 123; 200 nM, N = 120; 250 nM, N = 101; 500 nM, N = 48; 1 μM, N = 43; 10 μM, N = 100). (B) Weighted absolute bias ratio averages (matched PI = 0,1 blue bar; Partial match PI = 0.25, 0.75 gray bar; unbiased PI = 0.50 cyan bar. (C) Illustrative traces for treatment groups. Scale bar color represents time in seconds. (D) Effect of Notch inhibition on MAD. p-values shown in bar, 1-way comparison of treatment groups to control. (E) Habenula symmetry for vehicle controls (N = 8) and 100 nM Notch inhibitor treated (N = 9) larvae showing proportion with WT, symmetric (Sym), or reversed (Rev) phenotypes. WT larvae have the larger habenula in the left hemisphere. y279 neuron counts in the habenula (F: vehicle N = 8; 100 nM N = 9) and PT (G: vehicle N = 8; 100 nM N = 9). For neuron counts, regardless of hemisphere the larger habenula was classified as the ‘left’ habenula. (H,I) Representative maximum projection images showing y279 labeled neurons in vehicle and control. Scale bar 20 μm. (J) Area of her12 expression in the spinal cord following LY411575 treatment (Vehicle, N = 12; 100 nM, N = 13; 8 μM, N = 11). (K) Normalized distribution of HuC/D positive neurons following notch inhibition (Vehicle: Blue, N = 18; 100 nM: Yellow, N = 13; 8 μM: Magenta, N = 13). X-axis distance spans half the spinal cord (0 micron = lateral spinal cord; 55 micron = spinal cord midline). Comparison shown is between vehicle and 8 μM along the whole length of black bar between matched positions. Ribbons ± SEM. (L) Representative images of her12 expression in 27 hpf embryos. Lateral view of spinal cord (dotted outline). Scale bar 20 μm. (M) Representative HuC labeling in 24 hpf embryos showing dorsal view. Dotted line denotes spinal cord midline. Scale Bar 40 μm. Asterisk p < 0.05. |