
|
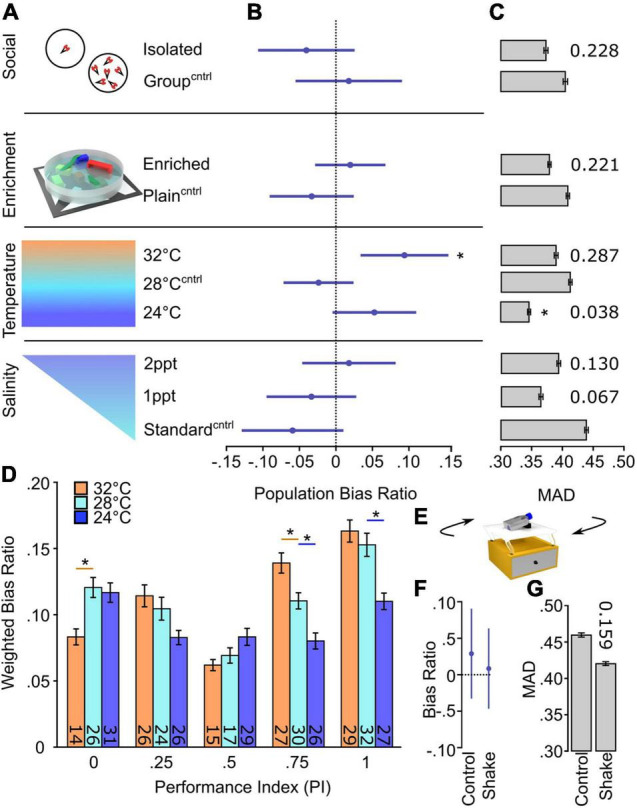
FIGURE 3
Temperature selectively changes inter-individual variation in turn bias. (A) Schematic of environmental manipulations (Social Isolated N = 87, Social Group N = 87; Enriched N = 172, Plain N = 134; Temp. 32°C N = 112, Temp. 28°C N = 136, Temp. 24°C N = 144; Standard salinity N = 102, 1 ppt N = 107, 2 ppt N = 107). Each condition has an independent control denoted by superscript Cntrl. (B) Average bias ratios across the entire tested population per condition. Statistical comparison performed to 0, denoting no population level bias. (C) MAD for dark responses, error bars are 95% confidence levels generated from 1,000 bootstraps. Individual p-values shown above bars, calculated by comparing experimental groups to controls. (D) Average bias ratio per PI weighted by the percent of individuals. N’s indicated within bars. (E) Representative diagram of the setup used to shake larvae during early development. Average population bias ratio (F) and MAD (G) between shake experiments. Number above bar represents p-value compared to the control group. Asterisk p < 0.05.