
- Title
-
IQ-Switch is a QF-based innocuous, silencing-free, and inducible gene switch system in zebrafish
- Authors
- Hong, J., Lee, J.G., Sohn, K.C., Lee, K., Lee, S., Lee, J., Hong, J., Choi, D., Hong, Y., Jin, H.S., Choi, D.K., Lee, S.U., Kee, Y., Jung, J., Bae, Y.K., Hwang, R.H., Hur, G.M., Lee, J.S., Ro, H.
- Source
- Full text @ Commun Biol
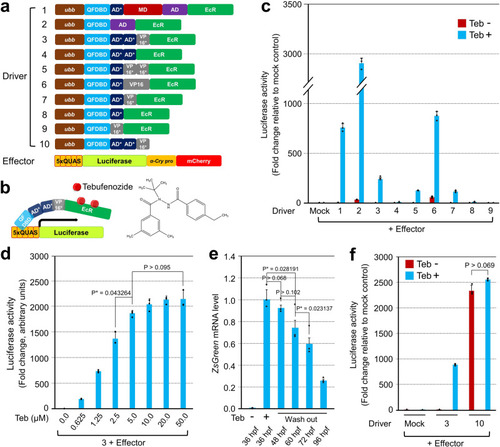
a Alignment of driver and effector constructs tested for the optimization of IQ-Switch. b Schematic drawing of an executing mechanism of IQ-Switch. The chemical structure of tebufenozide is depicted on the right. c Measurement of luciferase reporter activity after transfection of an individual driver plasmid, indicated by number, together with the same effector containing 5xQUAS elements. After 24 h, the transfected HEK293 cells were exposed to 10 µM of Teb for another 24 h before measurement. The luciferase reporter activity responding to Teb is indicated in azure; the basal leakiness of the effector by a specific inducer plasmid is visualized in reddish brown. d The combination of driver ‘3’ in (a) with the effector in HEK293 cells showed responsiveness in a Teb dosage-dependent manner. Error bars stand for the standard deviation. e Reversibility of IQ-Switch. The offspring of the genetic cross between Tg(ubb:QFDBD-2xAD*-VP16*-EcR) and Tg(5xQUAS:ZsGreen-P2A-lamin AΔ37) were subjected to RT-qPCR. After 50 µM of Teb was used to treat embryos at 12 hpf for 24 h, selected ZsGreen-positive embryos were cultured under the Teb-minus condition for the indicated period. Error bars stand for the standard error of the mean. f Measurement of luciferase activity in HEK293 cells after transiently transfecting the indicated combination of plasmids. The experimental conditions are identical to those in (c). Driver ‘10’ in (a) without EcR strongly stimulated the luciferase reporter activity irrespective of the presence of Teb, the difference of which was statistically non-significant. Luciferase activity was measured in triplicate or more. P-values were indicated in each figure. |
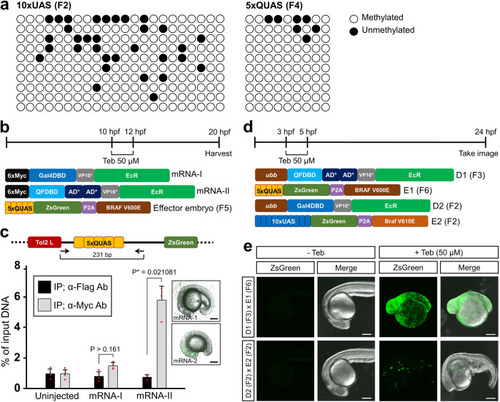
a The prepared genomic DNA from F2 offspring of Tg(10xUAS:ZsGreen-P2A-brafV610E) and F4 offspring of Tg(5xQUAS:ZsGreen-P2A-BRAFV600E) was subjected to bisulfite sequencing analysis. Both element regions became heavily methylated through successive generations. Open circles indicated methylated CpGs and dark circles represented unmethylated CpGs. Ten individual clones from each group were independently sequenced as shown on the vertical axis. b Schematic diagram of ChIP experiments in (c). The in vitro transcribed mRNA (50 pg) encoding 6xMyc-tagged Gal4DBD-VP16*-EcR and 6xMyc-QFDBD-2xAD*-VP16*-EcR was introduced into the embryos of Tg(5xQUAS:ZsGreen-P2A-BRAFV600E). The injected embryos were exposed to 50 µM of Teb for 2 h at the early somite stage and then harvested at 20 hpf. c An amplicon encompassing the 5xQUAS element region occupies 231 bp. ChIP assay of embryo with anti-Myc and anti-Flag antibody. The anti-Flag antibody was used as a negative control. The ChIP samples were subjected to qPCR with the indicated primers (arrows). While mRNA encoding 6xMyc-Gal4DBD-VP16*-EcR did not cause any embryonic malformation when exposed to Teb, sporadic exposure of 6xMyc-QFDBD-2xAD*-VP16*-EcR mRNA-injected embryos to Teb showed developmental defects (boxes). q-PCR was carried out in triplicate, and standard errors of the mean are shown in the panel. Error bars stand for the standard deviation. d The embryos were treated with 50 µM of Teb for 2 h before the onset of gastrulation and then observed at 24 hpf. e While ZsGreen reporter under the control of QF/5xQUAS showed ubiquitous expression in the whole embryo (D1 + E1), the same reporter was activated in random tissues when driven by Gal4/10xUAS (D2 + E2). Note that 10xUAS regulated by Gal4 was progressively silenced as early as F3 generation. Abbreviations: Teb; tebufenozide. Scale bar; 200 μm. |
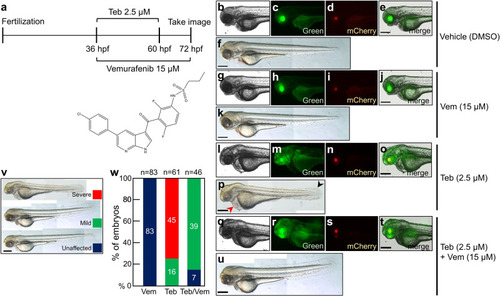
a While a low dose of Teb (2.5 µM) was used to treat the genetic cross of Tg(ubb:QFDBD-2xAD*-VP16*-EcR,α-cry:EGFP) and Tg(5xQUAS:ZsGreen-P2A-BRAFV600E,α-cry:mCherry) from 36 hpf to 60 hpf, 15 µM of vemurafenib was added to the transgenic embryos for an extended period from 36 hpf to 72 hpf. The live embryos were observed under an epifluorescence microscope at 72 hpf. The chemical structure of vemurafenib is shown below. b–u While green fluorescence in the lens manifested the existence of a driver cassette, mCherry in the lens represented an effector 5xQUAS:ZsGreen-P2A-BRAFV600E transgene in the genome. b–f DMSO vehicle treatment. g–k Treatment with 15 µM of vemurafenib alone. l–p Treatment with 2.5 µM of Teb alone. The embryos showed ZsGreen reporter expression in whole tissues. q–u A representative image of embryos exposed simultaneously to both Teb (2.5 µM) and vemurafenib (15 µM). Similar to that of Teb alone, green fluorescence was detected in all tissues. v Embryos were classified into three groups following embryonic malformation. w A graphical view of the embryonic defects as in (v). n represents the number of embryos analyzed. Abbreviations: Teb; tebufenozide, Vem; vemurafenib. Scale bar; 150 μm. |
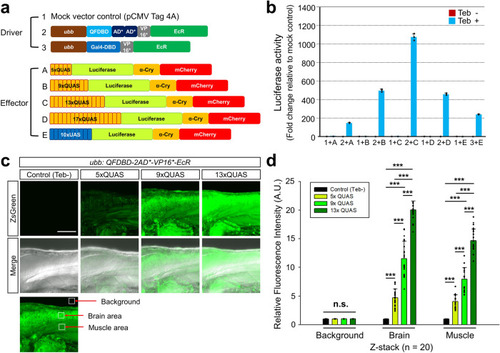
a Schematic drawing of driver and effector constructs. b Luciferase activities measured in HEK293 cells transiently transfected with the indicated driver and effector combinations. HEK293 cells were treated with 10 µM of Teb 24 h after transfection and then raised for another 24 h before harvest. Note that the combination of QF (“2”) and 13xQUAS (“C”) was the best at potentiating transgene induction. c Representative Z-stacking image of embryos at 3 dpf exposed to 10 μM of Teb for 24 h. Embryo harboring both the driver and 13xQUAS-regulated ZsGreen effector without treatment of Teb was used as a negative control, which could be easily selected by observation of red and green fluorescence in the lens. d The areas demarcated by open white boxes in (c) represented relative fluorescent intensities in the brain and muscle being evaluated in comparison to the level of control background intensity without Teb treatment, which was assumed as 1 arbitrary unit. Z-stacking images from randomly collected embryos (n = 20) were used to measure the expression level of ZsGreen regulated by 5x, 9x, and 13xQUAS. Error bars stand for the standard deviation. P-value indicated with (***) stands for < 0.001. Abbreviations: A.U.; arbitrary unit, n.s.; not significant, Teb; tebufenozide. Scale bar: 100 μm. |
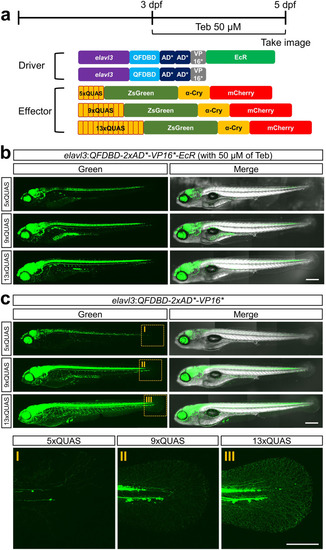
<a Schematic illustration of a driver under the control of elavl3 promoter and respective effectors harboring different numbers of QUAS. The driver constructs were equipped with 8.7 kb of elavl3 promoter instead of ubb promoter. Teb (50 µM) was administered for 48 h before imaging at 5 dpf. b Genetic cross of F1 Tg(elavl3:QFDBD-2xAD*-VP16-EcR) with indicated F2 effector lines. The siblings were exposed to Teb to induce ZsGreen transgene expression. Note that the intensity of ZsGreen reporter fluorescence in the pan-neuronal tissues driven by elavl3 promoter was gradually augmented in the order of the increased number of QUAS repeats. c Genetic cross of F1 Tg(elavl3:QFDBD-2xAD*-VP16*) with indicated F2 effector lines. The intensity of ZsGreen fluorescence among the siblings was most prominent with an effector harboring a 13xQUAS transgene. Abbreviations: Teb; tebufenozide. Scale bar: 200 μm. |
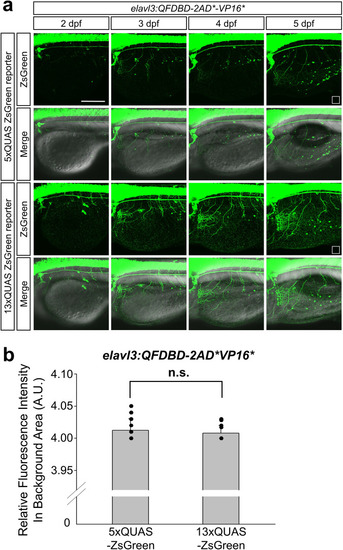
a Representative image of embryos at the indicated developmental stage. They obtained from genetic crosses between F2 Tg(elavl3:QFDBD-2xAD*-VP16*) and F3 effector lines having 5x or 13xQUAS-regulated ZsGreen reporter gene. b The points labeled with white open square box in (a) stand for the region used to level off background fluorescence intensity of 5x and 13xQUAS-ZsGreen groups. Comprehensive level of background fluorescence was measured with 12 single images derived from same number of embryos at 5 dpf under the identical confocal setting. No discernable differences were observed in two discrete clutches. Twelve embryos in each clutch were analyzed in the assay. Abbreviations: A.U.; arbitrary unit, n.s.; not significant, Teb; tebufenozide. Scale bar: 200 μm. |