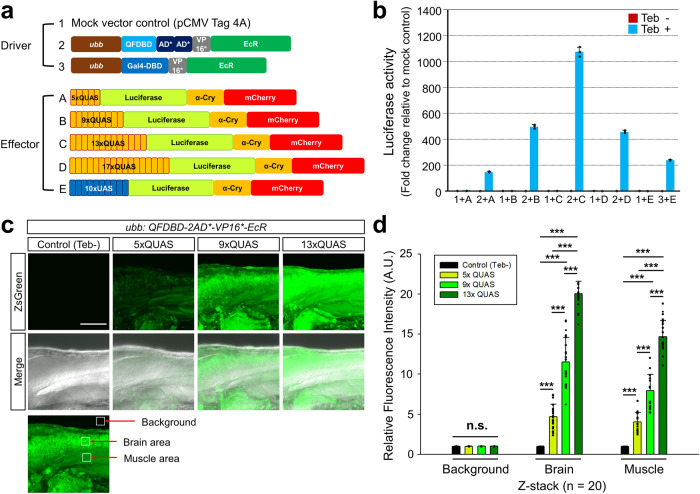
Fig. 4 a Schematic drawing of driver and effector constructs. b Luciferase activities measured in HEK293 cells transiently transfected with the indicated driver and effector combinations. HEK293 cells were treated with 10 µM of Teb 24 h after transfection and then raised for another 24 h before harvest. Note that the combination of QF (“2”) and 13xQUAS (“C”) was the best at potentiating transgene induction. c Representative Z-stacking image of embryos at 3 dpf exposed to 10 μM of Teb for 24 h. Embryo harboring both the driver and 13xQUAS-regulated ZsGreen effector without treatment of Teb was used as a negative control, which could be easily selected by observation of red and green fluorescence in the lens. d The areas demarcated by open white boxes in (c) represented relative fluorescent intensities in the brain and muscle being evaluated in comparison to the level of control background intensity without Teb treatment, which was assumed as 1 arbitrary unit. Z-stacking images from randomly collected embryos (n = 20) were used to measure the expression level of ZsGreen regulated by 5x, 9x, and 13xQUAS. Error bars stand for the standard deviation. P-value indicated with (***) stands for < 0.001. Abbreviations: A.U.; arbitrary unit, n.s.; not significant, Teb; tebufenozide. Scale bar: 100 μm.
Image
Figure Caption
Acknowledgments
This image is the copyrighted work of the attributed author or publisher, and
ZFIN has permission only to display this image to its users.
Additional permissions should be obtained from the applicable author or publisher of the image.
Full text @ Commun Biol

