
- Title
-
Asthma-associated genetic variants induce IL33 differential expression through an enhancer-blocking regulatory region
- Authors
- Aneas, I., Decker, D.C., Howard, C.L., Sobreira, D.R., Sakabe, N.J., Blaine, K.M., Stein, M.M., Hrusch, C.L., Montefiori, L.E., Tena, J., Magnaye, K.M., Clay, S.M., Gern, J.E., Jackson, D.J., Altman, M.C., Naureckas, E.T., Hogarth, D.K., White, S.R., Gomez-Skarmeta, J.L., Schoetler, N., Ober, C., Sperling, A.I., Nóbrega, M.A.
- Source
- Full text @ Nat. Commun.

Epigenetic characterization of the asthma-associated critical region in the IL33 locus.
a Schematic organization of the IL33 gene and the asthma-associated region (black bars) of European ancestry (CEU 41 kb, chr9: 6,172,380–6,213,468; hg19) and African ancestry (ASW 20 kb, chr9: 6,188,124–6,209,099; hg19) positioned upstream of exon 1. b Position of the lead GWAS SNPs (in red) and additional SNPs in high LD (r2 ≥ 0.8) with the lead SNPs (in black) within the ASW 20 kb LD region. The lead SNP rs1888909 in African ancestry is shown in blue. Chromatin states from Roadmap Epigenomics Project showing regions with potential regulatory activity. Yellow: active enhancer; green: transcribed sequence; blue: heterochromatin. DNase hypersensitive (DHS) sites indicating open chromatin regions are shown. Tissues (from the top): E096 Lung primary HMM; E095 Left ventricle primary HMM; E116 GM128781 Lymphoblastoid cell primary HMM; E122 HUVEC Umbilical Vein Endothelial Primary Cells Primary HMM. c ChIP-seq data from ENCODE-3 cell lines (338 factors; 130 cell types) showing co-binding of CTCF, RAD2, ZFNs, and SMC-3 at the 5 kb interval (blue shaded region; chr9: 6,194,500–6,199,500; hg19). d UCSC Multispecies conservation showing that the 5 kb region is not conserved across species. Organism (from the top): rhesus; mouse; dog; elephant. A single line means no bases in the alignment, and double lines indicate one or more unaligned bases. |
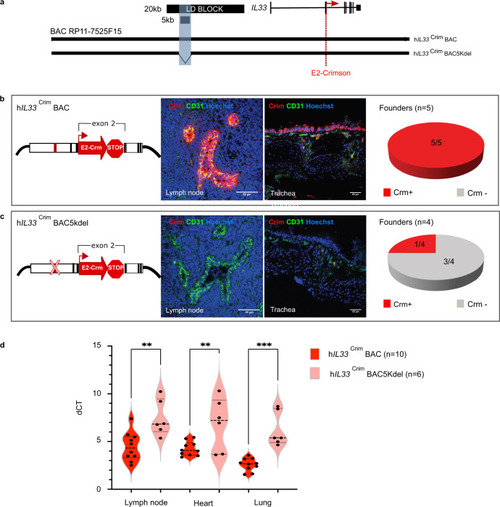
The IL33-containing BAC in transgenic mice encodes human-specific regulatory patterns and demonstrates the importance of the 5 kb noncoding segment for proper IL33 expression.
a Schematic of human BAC clone RP11-725F15 (166 kb) spanning the entire coding region of IL33 and its upstream region including the 20 kb asthma-associated interval and the 5 kb region of interest shaded in blue (black bars). To produce a human IL33 reporter strain, a cassette containing E2-Crimson with a stop sequence was inserted into exon 2, in frame with the IL33 translational start site (red dotted line). Transgenic mice were generated with either the full BAC (hIL33CrimBAC) or a BAC containing a deletion of the 5 kb interval within the LD block (hIL33Crim BAC5kdel). b, c Immunofluorescence staining of mouse peripheral lymph node sections (left panels) and trachea tissue sections (right panels) of E2-Crimson in hIL33Crim BAC mice (b) or hIL33Crim BAC5kdel (c). Representative founder BAC transgenic lines are shown. Sections were stained with anti-E2-Crimson (red) and the mouse endothelial cell marker CD31 (green). Hoechst 33342 staining for nuclei is in blue. Pie charts show the distribution of Crimson expression (Crm) in each “humanized” BAC mouse line. d qPCR analysis of E2-Crimson mRNA obtained from lymph node, heart, and lung from both BAC strains is shown. Violin plot shows average dCT values (Crimson/Ppia) obtained from animals containing either the full BAC or the 5 kb deletion (n = 10 biologically independent animals for full BAC and n = 6 biologically independent animals for 5 kb deletion). Center line: median; box limits: upper and lower quartiles; whiskers: 1.5 × interquartile range. **p = 0.0017 (lymph node); **p = 0.0066 (heart), ***0.0001; one-way ANOVA with post hoc Sidak multiple comparison test. Source data are provided as a Source Data file. |
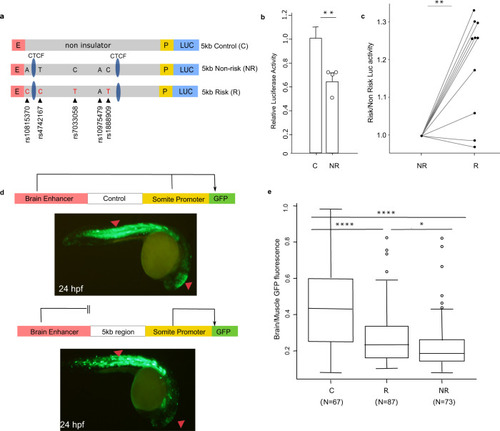
Impact of the asthma-associated variants in the regulatory property of the 5 kb region.
a In vitro transgenic reporter assay. Luciferase-based enhancer barrier assay using 5 kb constructs (non-risk or risk; chr9: 6,194,675–6,199,500; hg19) that were cloned between HS2 enhancer (E) and SV40 promoter (P) sequences and transfected into K562 cells. SNPs in the construct are noted (black arrowheads). b Enhancer barrier activity of the non-risk 5 kb region of interest compared to a same size control insert (chr7: chr7: 35,303,890–35,309,030; hg19). Data are presented as mean ± SEM, n = 4 independent experiments. **p = 0.0063, one-tailed paired Student’s t-test. c Luciferase activity values of the 5 kb risk construct is shown as fold change over the activity obtained in the 5 kb non-risk sequence, n = 10 independent experiments. **p = 0.0014, two-tailed paired Student’s t-test. d In vivo zebrafish transgenic reporter assay. Green fluorescent protein (GFP) expression 24 h post fertilization (hpf) in mosaic F0 embryos injected with vectors containing a control sequence (top panel) or 5 kb interval sequence (bottom panel). e Comparison between 5 kb constructs containing risk or non-risk haplotype for enhancer-blocking property. Data are presented as the midbrain/somites EGFP intensity ratio of risk and non-risk sequences compared to empty gateway vector which has no enhancer-blocking activity (n = 67 for risk, n = 73 for non-risk, and n = 87 for control, biologically independent animals). Boxplot center line, median; box limits, upper and lower quartiles; whiskers, 1.5 × interquartile range and data beyond that threshold indicated as outliers. ****p < 0.0001; *p = 0.049, one-way ANOVA with pos hoc Holm-Sidak multiple correction test. Source data are provided as a Source Data file. |
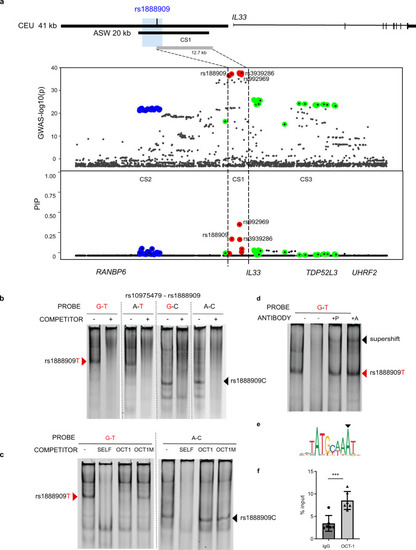
Potential causal GWAS SNP rs1888909T selectively binds OCT-1.
a Significance of SNP association in the GWAS2 (top) and fine mapping results (bottom) for each variant at the IL33 locus using SuSiE. Colors indicate each credible set (CS) identified. CS1: red, CS2 blue; CS3 green. CS1 (rs992969, rs1888909, rs3939286) defines a region of 12.7 kb (chr9: 6,197,392–6,210,099; hg19). Rs1888909 is the only variant that overlaps to the 5 kb region of interest (blue shade; chr9: 6,194,500–6,199,500; hg19). b Radiolabeled probes carrying the risk (in red) and/or non-risk sequences for SNPs rs10975479 and rs1888909 were incubated with nuclear extract obtained from K562 cells. Different complexes formed by rs1888909 are marked by red or black arrows. c Cold competition assay with OCT-1 consensus (OCT1) or mutated OCT-1 (OCT1M) oligonucleotides. EMSA probes and oligo competitor (100× molar excess) are noted above each gel. d Supershift complex formation with addition of anti-OCT-1 antibody as indicated by the black arrow. +P indicates addition of probe with nuclear extract followed by incubation with antibody. +A indicates incubation of extract with antibody followed by addition of probe;. e OCT-1 binding motif (JASPAR; MA0785.1) f Chromatin immunoprecipitation of H292 chromatin with anti-OCT-1 antibody followed by qPCR (ChIP-PCR). Plot shows enrichment of OCT-1 binding compared to input chromatin (IgG). Data are presented as mean ± SD (n = 2 independent experiments in triplicate each). ***P = 0.0004, one-tailed unpaired Student’s t-test. Source data are provided as a Source Data file. |
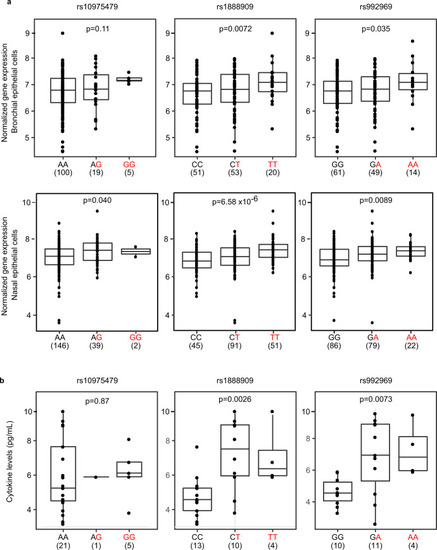
The rs1888909 (T) and rs992969 (A) alleles are associated with increased IL33 expression and IL-33 protein levels.
a Comparison of IL33 expression between genotypes for SNPs rs10975479, rs1888909, and rs992969 from bronchial epithelial cells from 124 asthmatic and non-asthmatic adult subjects, mostly of European ancestry (upper panels) and nasal epithelial cells from 189 African-American children from high risk asthma families (lower panels). b Comparison of IL-33 cytokine levels between genotypes for SNPs rs10975479 (n = 27), rs1888909 (n = 27), and rs992969 (n = 25) measured in plasma from Hutterite children (all European ancestry). The asthma-associated risk allele at each SNP is highlighted in red (x-axis). The number of subjects per group is shown below the genotype. Boxplot center line: median; box limits: upper and lower quartiles; whiskers: 1.5× interquartile range. Statistical significance was determined using an additive linear model. Source data are provided as a Source Data file. |