
|
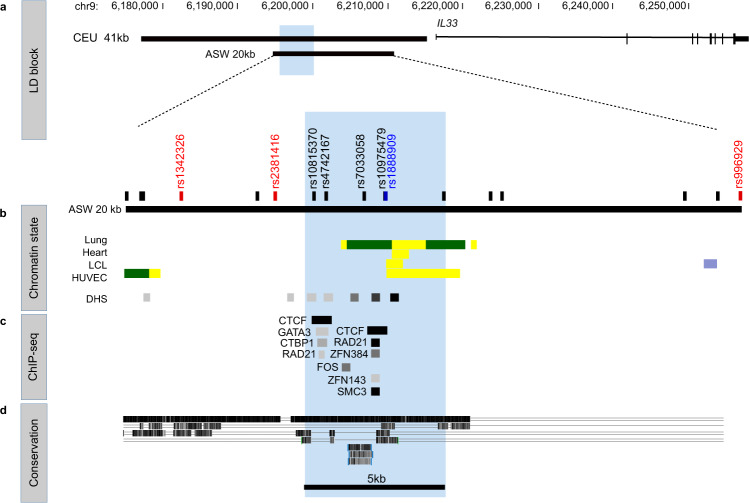
Fig. 1
a Schematic organization of the IL33 gene and the asthma-associated region (black bars) of European ancestry (CEU 41 kb, chr9: 6,172,380–6,213,468; hg19) and African ancestry (ASW 20 kb, chr9: 6,188,124–6,209,099; hg19) positioned upstream of exon 1. b Position of the lead GWAS SNPs (in red) and additional SNPs in high LD (r2 ≥ 0.8) with the lead SNPs (in black) within the ASW 20 kb LD region. The lead SNP rs1888909 in African ancestry is shown in blue. Chromatin states from Roadmap Epigenomics Project showing regions with potential regulatory activity. Yellow: active enhancer; green: transcribed sequence; blue: heterochromatin. DNase hypersensitive (DHS) sites indicating open chromatin regions are shown. Tissues (from the top): E096 Lung primary HMM; E095 Left ventricle primary HMM; E116 GM128781 Lymphoblastoid cell primary HMM; E122 HUVEC Umbilical Vein Endothelial Primary Cells Primary HMM. c ChIP-seq data from ENCODE-3 cell lines (338 factors; 130 cell types) showing co-binding of CTCF, RAD2, ZFNs, and SMC-3 at the 5 kb interval (blue shaded region; chr9: 6,194,500–6,199,500; hg19). d UCSC Multispecies conservation showing that the 5 kb region is not conserved across species. Organism (from the top): rhesus; mouse; dog; elephant. A single line means no bases in the alignment, and double lines indicate one or more unaligned bases.