
|
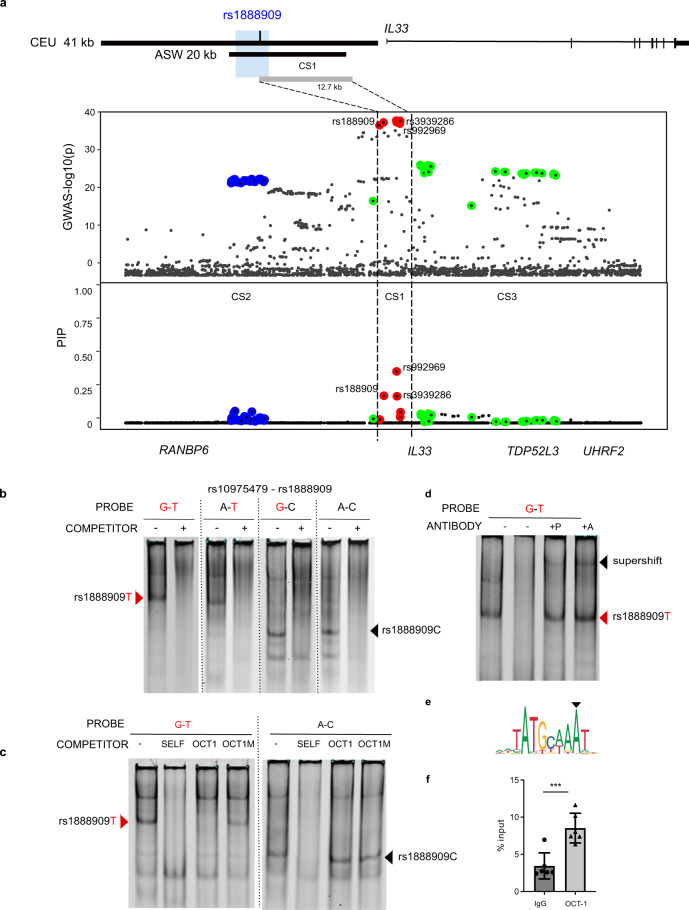
Fig. 4
a Significance of SNP association in the GWAS2 (top) and fine mapping results (bottom) for each variant at the IL33 locus using SuSiE. Colors indicate each credible set (CS) identified. CS1: red, CS2 blue; CS3 green. CS1 (rs992969, rs1888909, rs3939286) defines a region of 12.7 kb (chr9: 6,197,392–6,210,099; hg19). Rs1888909 is the only variant that overlaps to the 5 kb region of interest (blue shade; chr9: 6,194,500–6,199,500; hg19). b Radiolabeled probes carrying the risk (in red) and/or non-risk sequences for SNPs rs10975479 and rs1888909 were incubated with nuclear extract obtained from K562 cells. Different complexes formed by rs1888909 are marked by red or black arrows. c Cold competition assay with OCT-1 consensus (OCT1) or mutated OCT-1 (OCT1M) oligonucleotides. EMSA probes and oligo competitor (100× molar excess) are noted above each gel. d Supershift complex formation with addition of anti-OCT-1 antibody as indicated by the black arrow. +P indicates addition of probe with nuclear extract followed by incubation with antibody. +A indicates incubation of extract with antibody followed by addition of probe;. e OCT-1 binding motif (JASPAR; MA0785.1) f Chromatin immunoprecipitation of H292 chromatin with anti-OCT-1 antibody followed by qPCR (ChIP-PCR). Plot shows enrichment of OCT-1 binding compared to input chromatin (IgG). Data are presented as mean ± SD (n = 2 independent experiments in triplicate each). ***P = 0.0004, one-tailed unpaired Student’s t-test. Source data are provided as a Source Data file.