
- Title
-
Lysosomal Function Impacts the Skeletal Muscle Extracellular Matrix
- Authors
- Coffey, E.C., Astumian, M., Alrowaished, S.S., Schaffer, C., Henry, C.A.
- Source
- Full text @ J Dev Biol
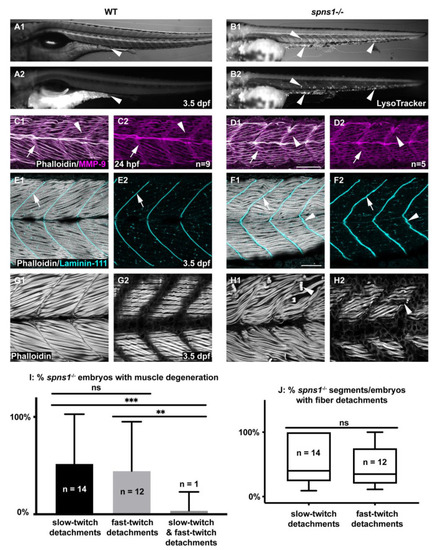
Developmental characterization of spns1−/− embryos and larvae. Anterior left, dorsal top, side-mounted embryos and larvae. (A1,B1) WT and (A2,B2) spns1−/− brightfield and LysoTracker staining at 3.5 dpf. Arrowheads indicate enlarged LysoTracker positive puncta in spns1−/− larvae. (C1–D2) Phalloidin staining (white) for actin and MMP-9 antibody (purple) staining in 1 dpf embryos. (C1) Merged WT and (D1) spns1−/− channels and (C2,D2) single MMP-9 channel. Arrows indicate MMP-9 staining at the MTJ while arrowheads indicate MMP-9 staining localized at muscle fibers. Scale bar 50 µm (E1–F2) Phalloidin staining (white) and beta-dystroglycan antibody (cyan) staining in 3.5 dpf larvae. (E1) WT and (F1) spns1−/− merged channels and (E2,F2) beta-dystroglycan single channel. Arrows indicate beta-dystroglycan staining at the MTJ while arrowheads indicate wavy beta-dystroglycan staining at the MTJ in spns1−/− larvae. Scale bar 50 µm. (G1,G2,H1,H2) Phalloidin staining of WT and spns1−/− fast and slow muscle fibers in 3.5 dpf larvae. Arrowheads indicate fiber detachments in spns1−/− larvae. Scale same as (F1). (I) Quantification of spns1−/− larvae (n = 27) with slow, fast, or both types of muscle fiber detachments. (J) Quantification of the percent of total myotomes in spns1−/− larvae (n = 27) with fast or slow muscle fiber detachments. Box and Whisker plot with whiskers denoting minimum and maximum values. ** for p < 0.01, and *** for p < 0.001. EXPRESSION / LABELING:
PHENOTYPE:
|
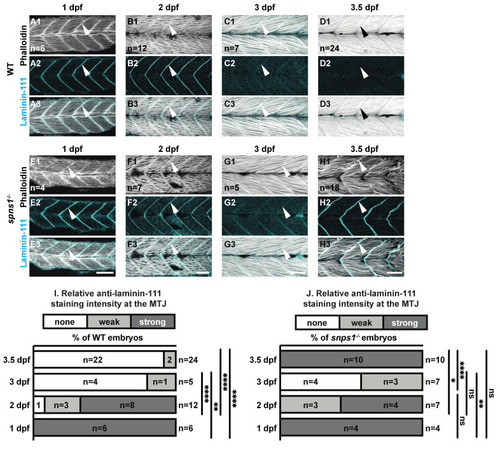
Normal initial muscle development is followed by abnormal 3.5 dpf laminin-111 levels in spns1−/− embryos and larvae. (A1–H3) Anterior left, dorsal top, side-mounted embryos and larvae stained with phalloidin (white) to visualize actin and laminin-111 antibodies (cyan). (A1–H1) Phalloidin staining. (A2–H2) Laminin-111 staining. (A3–H3) Merged phalloidin and laminin-111 channels. White arrowheads point to laminin-111 localized to the MTJ. Laminin-111 staining, not detected in WT embryos and larvae at 3–3.5 dpf, is detected in (H2–H3) spns1−/− 3.5 dpf larvae. (I,J) Relative fluorescent intensity of laminin-111 protein in WT and spns1−/− embryos and larvae over time (see methods). * p < 0.05, ** p < 0.01, **** p < 0.0001. Scale bars 50 µm. EXPRESSION / LABELING:
PHENOTYPE:
|
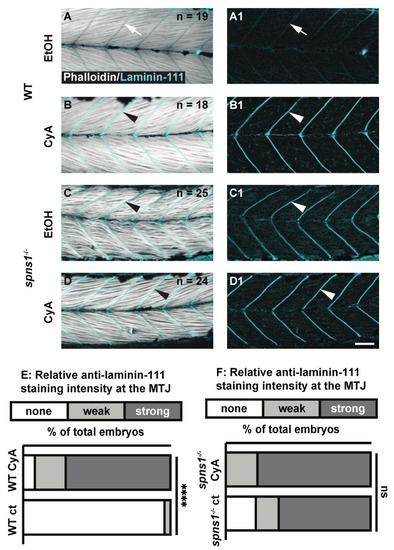
Sonic Hedgehog signaling is not required for laminin-111 protein re-expression in 3.5 dpf spns1−/− larvae. (A–D1) Anterior left, dorsal top, side-mounted 3.5 dpf WT and spns1−/− larvae stained with phalloidin (white) and laminin-111 (cyan) post vehicle control or post 50 μM cyclopamine treatment. (A,A1,C,C1) Phalloidin and laminin-111 staining after EtOH vehicle control treatment in (A,A1) WT and (C,C1) spns1−/− larvae. (A–A1) White arrows point to MTJ in WT larvae. Note absence of laminin-111 protein in WT embryos and presence of laminin-111 protein in spns1−/− larvae. (B,B1,D,D1) Phalloidin and laminin-111 staining after cyclopamine treatment in WT and spns1−/− larvae. White arrowheads point to laminin-111 staining at the MTJ. (E,F) Relative fluorescent intensity of laminin-111 staining in (E) WT and (F) spns1−/− larvae after ethanol or cyclopamine exposure. **** p < 0.0001. Scale bar 50 µm. EXPRESSION / LABELING:
PHENOTYPE:
|
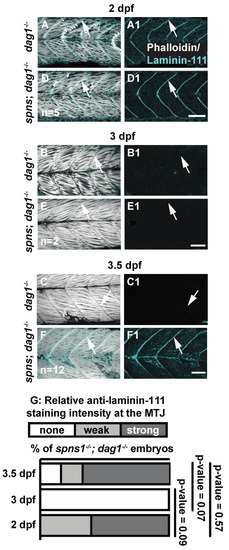
Laminin receptor beta-dystroglycan is not required for laminin-111 protein re-expression at 3.5 dpf in spns1−/− larvae. (A–F1) Anterior left, dorsal top, side-mounted embryos, and larvae. dag1−/− and spns1−/−; dag1−/− embryos and larvae stained with phalloidin (white) and laminin-111(cyan), (A–F) Merged phalloidin and laminin-111 channels and (A1–F1) single beta-dystroglycan channel over time. (A–F) White arrowheads point to dystrophic lesions and (A1–F1) white arrowheads point to laminin-111 staining. (G) Relative laminin-111 fluorescent intensity over time in spns1−/−; dag1−/− embryos and larvae. Scale bars 50 µm. EXPRESSION / LABELING:
PHENOTYPE:
|
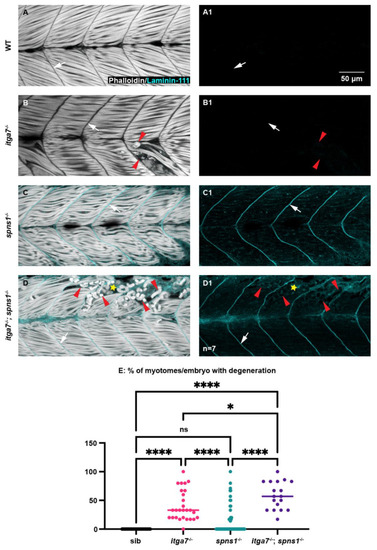
The laminin receptor integrin α7 is not required for laminin-111 protein re-expression at 3.5 dpf in spns1−/− larvae but does contribute to muscle resilience in spns1−/− larvae. (A–D) Anterior left, dorsal top, side-mounted larvae. Phalloidin (white) and laminin-111 (cyan) stained WT, itga7−/−, spns1−/−, and spns1−/−; itga7−/− larvae at 3.5 dpf. (A–D) Merged phalloidin and laminin-111 channels and (A1–D1) single laminin-111 channel. White arrows indicate the MTJ. Red arrowheads point to dystrophic lesions. Yellow star indicates aberrant laminin-111 surrounding detached fibers. (E) Percent of myotomes with dystrophic lesions. Note the significant increase in muscle degeneration in spns1−/−; itga7−/− larvae compared to itga7−/− single mutants. * p < 0.05, **** p < 0.0001. Scale bar 50 µm. EXPRESSION / LABELING:
PHENOTYPE:
|
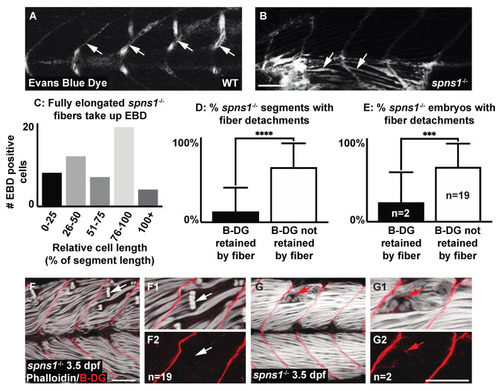
Muscle fiber failure is due to sarcolemmal integrity failure in spns1−/− 3.5 dpf larvae. (A,B,F,G) Anterior left, dorsal top, side-mounted 3.5 dpf larvae. (A,B) WT and spns1−/− 3.5 dpf larvae injected with 1% Evans Blue Dye (EBD). (A,B) White arrows indicate the presence of EBD. (A) In WT larvae EBD remains in the bloodstream but in (B) spns1−/− larvae EBD penetrates full length muscle fibers, indicating membrane damage. (C) Quantification of relative cell length of EBD-penetrated myofibers in spns1−/− larvae shows that fully elongated fibers in spns1−/− larva take up EBD. (D) Percentage of segments with beta-dystroglycan containing fibers and beta-dystroglycan negative fibers in spns1−/− larvae. Note that beta-dystroglycan remains at the MTJ the majority of the time. (E) Percentage of spns1−/− larvae with beta-dystroglycan containing fibers and beta-dystroglycan negative fibers. *** p < 0.001, **** p < 0.0001. (F–G2) Phalloidin (white) and beta-dystroglycan staining (red) of 3.5 dpf spns1−/− larvae. (F,F1,G,G1) Merged phalloidin and beta-dystroglycan channels and (F2,G2) beta-dystroglycan single channel. (F–F2) White arrows point to retracted fibers that do not contain beta-dystroglycan at their detached ends. (G–G2) Red arrows point to retracted fibers that contain beta-dystroglycan at their detached ends. Scale bars 50 µm. EXPRESSION / LABELING:
PHENOTYPE:
|
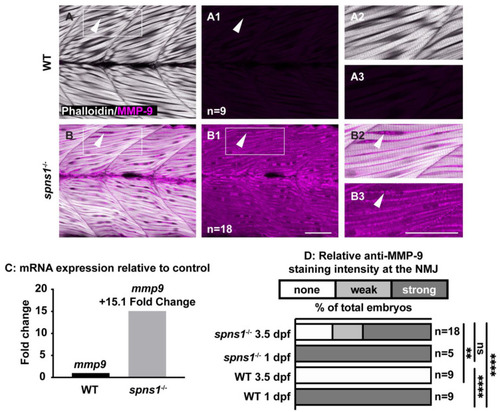
mmp9 mRNA and protein are upregulated in spns1−/− larvae at 3.5 dpf. (A,B) Anterior left, dorsal top, side-mounted larvae. Phalloidin (white) to visualize actin and MMP-9 antibody staining (pseudo-colored fuchsia). (A,A2,B,B2) Merged phalloidin and MMP-9 channels and (A1,B1,A3,B3) MMP-9 single channel. (A1) MMP-9 is not detected in WT muscle. (B1) MMP-9 is detected in spns1−/− muscle. White arrowheads highlight MMP-9 staining (or lack thereof in wild-type larvae). (C) Relative mmp9 mRNA expression in WT and spns1−/− larvae measured as fold change in 3.5 dpf larvae. (D) Percentage of spns1−/− and WT at 1 and 3.5 dpf with qualitatively scored relative fluorescence intensity. ** p < 0.01, **** p < 0.0001. Scale bars 50 µm. EXPRESSION / LABELING:
PHENOTYPE:
|
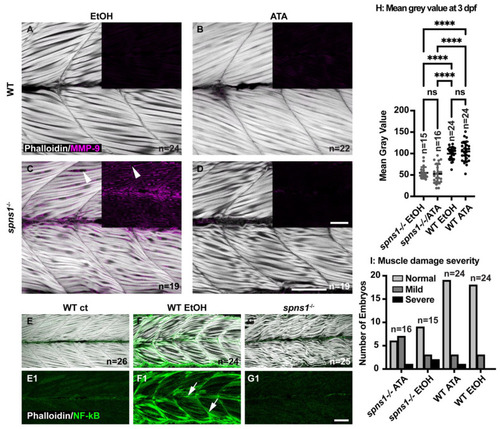
Tnfsf12 inhibition affects MMP-9 protein levels independently of NF-κB but reducing MMP-9 does not reduce muscle degeneration. (A–G) Anterior left, dorsal top, side-mounted 3.5 dpf larvae. (A–D) Merged phalloidin and MMP-9 stained (pseudo-colored fuchsia) channels in WT and spns1−/− larvae, MMP-9 staining alone is in black inset boxes. Zebrafish were treated with either 2% EtOH from 30 hpf–3.5 dpf or 100 μM TWEAK inhibitor Aurintricarboxylic acid (ATA) from 30 hpf–3.5 dpf. (A,B) Absence of MMP-9 protein in WT zebrafish treated with EtOH and with ATA. (C) Presence of MMP-9 protein in spns1−/− zebrafish treated with EtOH. White arrowheads indicate MMP-9 positive staining. (D) Absence of MMP-9 protein in spns1−/− zebrafish treated with ATA. (E–G) Merged phalloidin (white) and EGFP (green) channels in EtOH treated and untreated Tg(NF-κB-EGFP); WT and Tg(NF-κB-EGFP); spns1−/− zebrafish. (E1–G1) EGFP single channel. White arrows indicate NF-κB-EGFP positive muscle fibers in (F1) EtOH treated WT zebrafish, but NF-κB-EGFP is not upregulated in spns1−/− mutants. (H) Changes in muscle structure, as measured by mean gray value, were insignificant in 3 dpf spns1−/− zebrafish treated with ATA or EtOH vehicle control. (I) Treatment with ATA and the subsequent reduction in MMP-9 does not improve muscle structure in spns1−/− mutants as assayed by either birefringence (H) or qualitative assessment of muscle structure after phalloidin staining (I). Categories are normal (healthy tissue), mild (fiber disorganization), or severe (fiber disorganization and fiber balls/MTJ failure). **** p < 0.0001. Scale bars 50 µm. EXPRESSION / LABELING:
PHENOTYPE:
|

ZFIN is incorporating published figure images and captions as part of an ongoing project. Figures from some publications have not yet been curated, or are not available for display because of copyright restrictions. EXPRESSION / LABELING:
PHENOTYPE:
|