
- Title
-
Generation of a Transgenic Zebrafish Line for In Vivo Assessment of Hepatic Apoptosis
- Authors
- Higuchi, A., Wakai, E., Tada, T., Koiwa, J., Adachi, Y., Shiromizu, T., Goto, H., Tanaka, T., Nishimura, Y.
- Source
- Full text @ Pharmaceuticals (Basel)
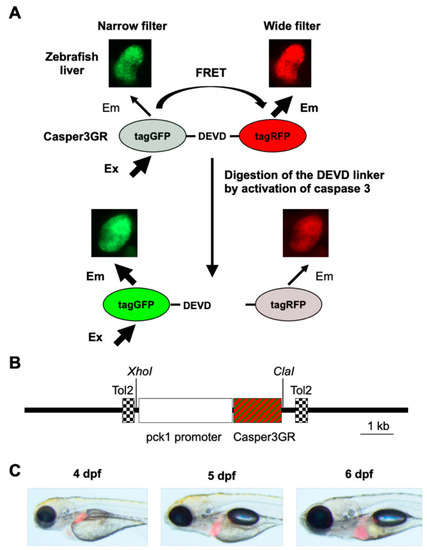
Assessment of hepatic apoptosis in zebrafish using FRET-based imaging. (A) FRET-based imaging technique developed in this study. Zebrafish expressing Casper3GR in hepatocytes were subjected to in vivo fluorescent imaging. When caspase 3 is not activated in the hepatocytes, the linker between tagGFP and tagRFP is not digested, resulting in FRET (i.e., excitation at the absorbance wavelength of tagGFP causes emission by tagRFP). When caspase 3 is activated in the hepatocytes, the linker is digested, which causes a decrease in FRET efficiency. In vivo fluorescence images of zebrafish liver obtained using a narrow filter (Ex/Em: 460–480/505–530 nm) and wide filter (Ex/Em: 460–480/567–647 nm) are also shown. (B) Diagram of the transposon vector used in this study. The coding region of Casper3GR was placed downstream of the regulatory sequences of pck1 and cloned between two Tol2 sequences in the vector backbone to direct selective protein expression in hepatocytes. (C) In vivo fluorescence imaging of Tg (pck1:Casper3GR) at 4, 5, and 6 dpf. The bright-field, GFP filter (Ex/Em: 460–490/510 nm), and RFP filter (Ex/Em: 545–580/610 nm) images are merged. |
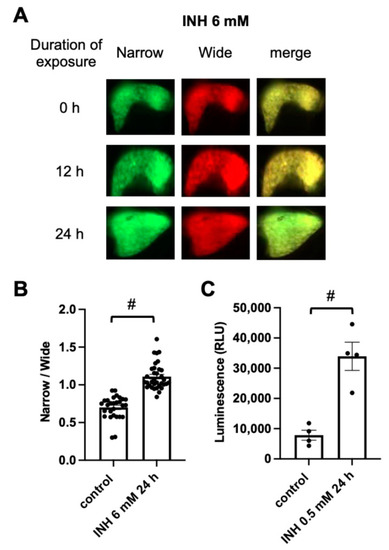
Assessment of hepatic apoptosis in INH-treated Tg (pck1:Casper3GR). (A) Representative in vivo fluorescence images of Tg (pck1:Casper3GR) treated with INH at 4 dpf. Images acquired using a narrow and wide filter and merged images are shown. (B) Hepatic apoptosis was assessed as the ratio of narrow and wide area of fluorescence above the threshold in the liver of zebrafish at 5 dpf treated with or without INH (6 mM for 24 h). Circles represent individual zebrafish, and bars represent the group means with standard error of the means. n = 28 and 34 for control and INH 6 mM 24 h, respectively. # p < 0.05 vs. control. (C) Hepatic apoptosis was assessed based on the luminescence derived from substrates that become luminogenic after digestion at the DEVD site by activated caspase 3/7 in extracts of liver isolated from zebrafish at 1 mpf treated with or without INH (0.5 mM for 24 h). Circles represent individual zebrafish, and bars represent the group means with standard error of the means. n = 4 for each group. |
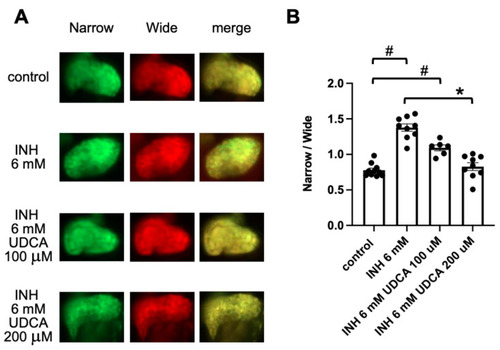
Assessment of hepatic apoptosis in Tg (pck1:Casper3GR) treated with INH with and without UDCA. (A) Representative in vivo fluorescence images of Tg (pck1:Casper3GR) treated with INH with and without UDCA from 4 to 5 dpf. Images acquired using narrow and wide filters and merged images are shown. (B) Hepatic apoptosis was assessed as the ratio of narrow and wide areas of fluorescence above the threshold in the liver of zebrafish at 5 dpf treated with INH with and without UDCA. Circles represent individual zebrafish, and bars represent the group means with standard error of the means. n = 10, 9, 6, and 9 for control, INH 6 mM, INH 6 mM UDCA 100 μM, and INH 6 mM UDCA 200 μM, respectively. # p < 0.05 vs. control, * p < 0.05 vs. INH 6 mM. |
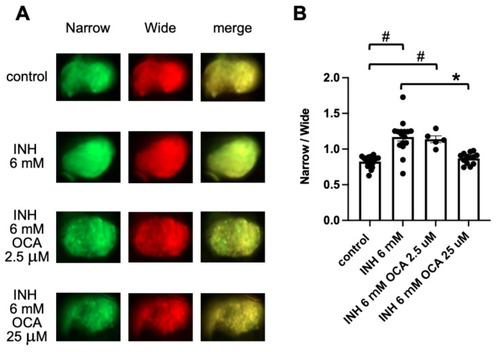
Assessment of hepatic apoptosis in Tg (pck1:Casper3GR) treated with INH with and without OCA. (A) Representative in vivo fluorescence images of Tg (pck1:Casper3GR) treated with INH with and without OCA from 4 to 5 dpf. Images acquired using narrow and wide filters and merged images are shown. (B) Hepatic apoptosis was assessed as the ratio of narrow and wide areas of fluorescence above the threshold in the liver of zebrafish at 5 dpf treated with INH with and without OCA. Circles represent individual zebrafish, and bars represent the group means with standard error of the means. n = 18, 16, 5, and 13 for control, INH 6 mM, INH 6 mM OCA 2.5 μM, and INH 6 mM OCA 25 μM, respectively. # p < 0.05 vs. control, * p < 0.05 vs. INH 6 mM. |
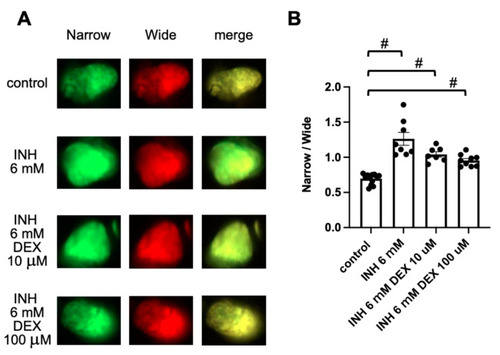
Assessment of hepatic apoptosis in Tg (pck1:Casper3GR) treated with INH with and without DEX. (A) Representative in vivo fluorescence images of Tg (pck1:Casper3GR) treated with INH with and without DEX from 4 to 5 dpf. Images acquired using narrow and wide filters and merged images are shown. (B) Hepatic apoptosis was assessed as the ratio of narrow and wide areas of fluorescence above the threshold in the liver of zebrafish at 5 dpf treated with INH with and without DEX. Circles represent individual zebrafish, and bars represent the group means with standard error of the means. n = 13, 8, 7, and 9 for control, INH 6 mM, INH 6 mM DEX 10 μM, and INH 6 mM DEX 100 μM, respectively. # p < 0.05 vs. control. |