
|
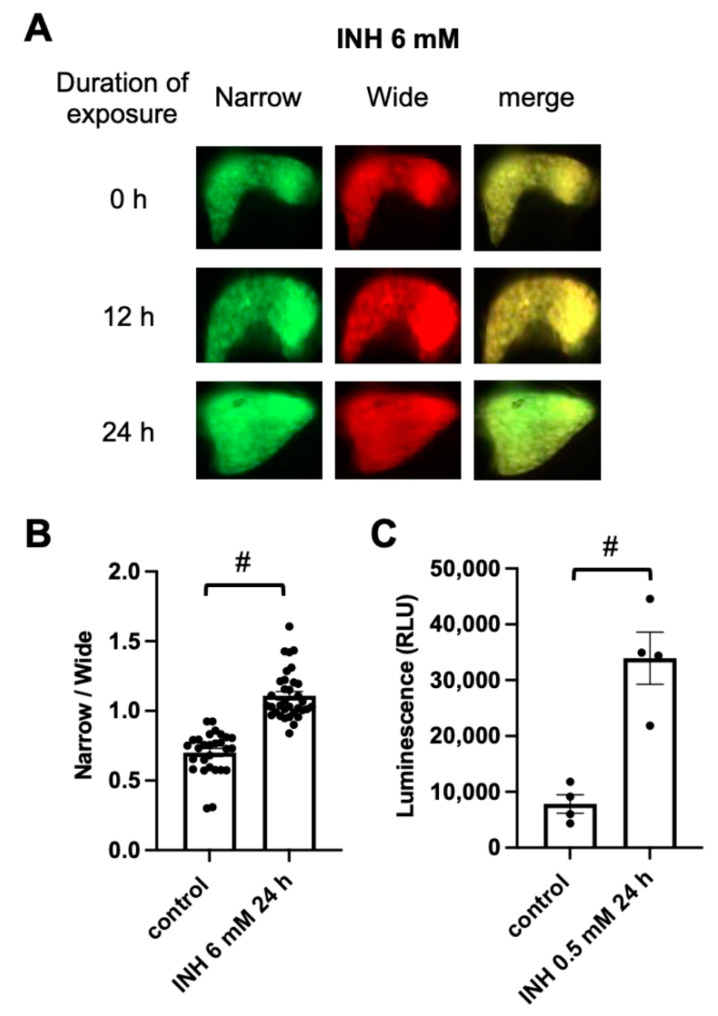
Figure 2
Assessment of hepatic apoptosis in INH-treated Tg (pck1:Casper3GR). (A) Representative in vivo fluorescence images of Tg (pck1:Casper3GR) treated with INH at 4 dpf. Images acquired using a narrow and wide filter and merged images are shown. (B) Hepatic apoptosis was assessed as the ratio of narrow and wide area of fluorescence above the threshold in the liver of zebrafish at 5 dpf treated with or without INH (6 mM for 24 h). Circles represent individual zebrafish, and bars represent the group means with standard error of the means. n = 28 and 34 for control and INH 6 mM 24 h, respectively. # p < 0.05 vs. control. (C) Hepatic apoptosis was assessed based on the luminescence derived from substrates that become luminogenic after digestion at the DEVD site by activated caspase 3/7 in extracts of liver isolated from zebrafish at 1 mpf treated with or without INH (0.5 mM for 24 h). Circles represent individual zebrafish, and bars represent the group means with standard error of the means. n = 4 for each group.