
|
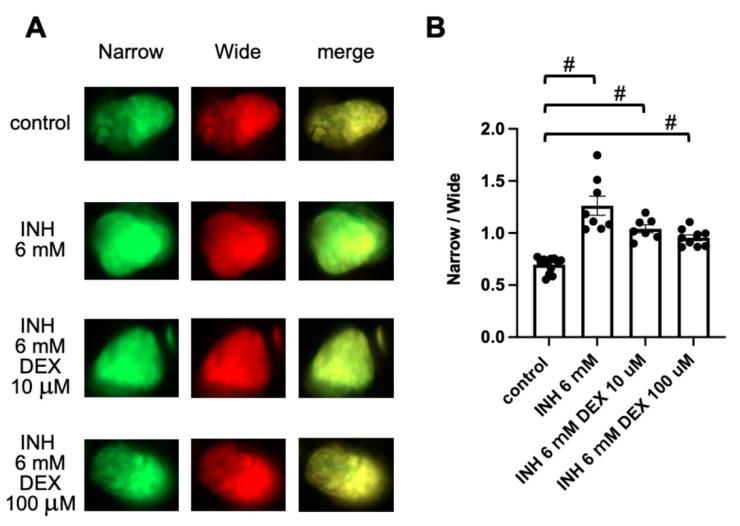
Figure 5
Assessment of hepatic apoptosis in Tg (pck1:Casper3GR) treated with INH with and without DEX. (A) Representative in vivo fluorescence images of Tg (pck1:Casper3GR) treated with INH with and without DEX from 4 to 5 dpf. Images acquired using narrow and wide filters and merged images are shown. (B) Hepatic apoptosis was assessed as the ratio of narrow and wide areas of fluorescence above the threshold in the liver of zebrafish at 5 dpf treated with INH with and without DEX. Circles represent individual zebrafish, and bars represent the group means with standard error of the means. n = 13, 8, 7, and 9 for control, INH 6 mM, INH 6 mM DEX 10 μM, and INH 6 mM DEX 100 μM, respectively. # p < 0.05 vs. control.