
- Title
-
Knockout of the hsd11b2 Gene Extends the Cortisol Stress Response in Both Zebrafish Larvae and Adults
- Authors
- Theodoridi, A., Dinarello, A., Badenetti, L., Pavlidis, M., Dalla Valle, L., Tsalafouta, A.
- Source
- Full text @ Int. J. Mol. Sci.
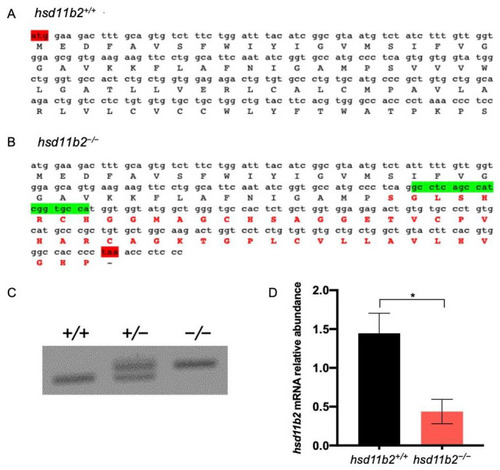
Generation of hsd11b2 mutant zebrafish line. (A) Partial (from the start codon) nucleotide and aminoacidic sequence of hsd11b2 in WT animals. (B) Partial (from the start codon) nucleotide and aminoacidic sequence of hsd11b2 in mutant animals showing in green the 19-nt insertion. (C) Representative picture of hsd11b2+/+, hsd11b2+/− and hsd11b2−/− genotyping in 2% agarose gel. (D) RT-qPCR of hsd11b2 transcripts in hsd11b2+/+ and hsd11b2−/− 5-dpf larvae. n = 4 independent biological replicas. Mean ± SEM. Statistical significance was determined by Student’s t-test. * p < 0.05. |
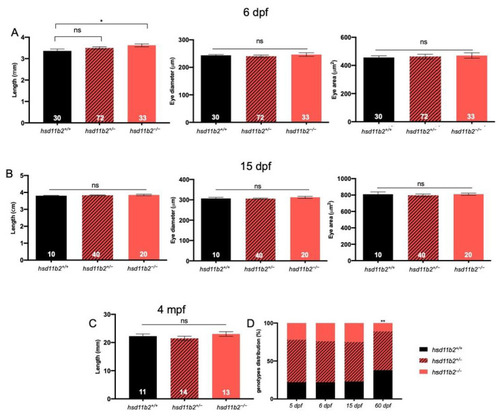
Morphometric analysis of hsd11b2 mutant zebrafish line. (A) Measurements of body length, eye diameter and eye area of 6-dpf hsd11b2+/+, hsd11b2+/− and hsd11b2−/− larvae. (B) Measurements of body length, eye diameter and eye area of 15-dpf hsd11b2+/+, hsd11b2+/− and hsd11b2−/− larvae. (C) Measurements of body length of 3-mpf hsd11b2+/+, hsd11b2+/− and hsd11b2−/− fish. (D) Survival of hsd11b2+/+, hsd11b2+/− and hsd11b2−/− animals at 5, 6, 15 and 60 dpf. Mean ± SEM. significant. Student’s t-test was used to evaluate the morphometric differences and X2 test was used to evaluate the differences of genotype distribution compared to the expected ratios. * p < 0.05; ** p < 0.01; ns = not significant. |
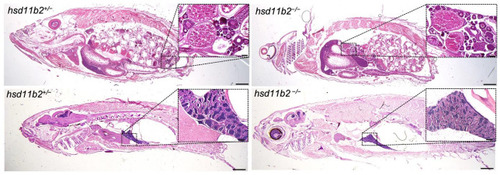
Histological analysis of 8-mpf female (top panels) and males (bottom panels) hsd11b2+/− and hsd11b2−/− zebrafish (scale bar = 1 mm). Magnification of ovaries (top panels) and testis (bottom panels) (scale bar = 100 um). PHENOTYPE:
|

Effect of acute stress application on whole-body cortisol concentrations of individual larvae at 5 dpf, as depicted by bar graphs. Measurements of 10 individual hsd11b2+/+ (WT) and 10 individual hsd11b2−/− (mutant larvae) was performed prior to (control) and 5, 10, 15, 30, 60 and 120 min after the stress application. Values are means ± SEM. Means with different letters differ significantly from one another (p < 0.001). Asterisks show statistically significant differences between the two groups (p < 0.001). Holm-Sidak comparison test was applied to identify groups that were significantly different. * p < 0.05, ** p < 0.01. Data for the two different genotypes are separated by the dot line in the graph. PHENOTYPE:
|

Analysis of GC-dependent transcriptional activities. (A) Representative pictures of 5-dpf hsd11b2+/+, hsd11b2+/−, and hsd11b2−/− larvae in Tg(9xGCRE-HSV.Ul23:EGFP)ia20 transgenic background. (B) Fluorescence quantification of 5-dpf hsd11b2+/+, hsd11b2+/−, and hsd11b2−/− larvae in Tg(9xGCRE-HSV.Ul23:EGFP)ia20 transgenic background. Scale bar = 1 mm. Statistical significance was determined by Student’s t-test. ns = not significant. Mean ± SEM. EXPRESSION / LABELING:
|
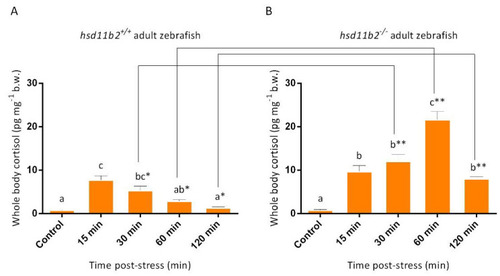
Effect of acute stress application on whole-body cortisol concentrations of one-year-old adult zebrafish, as depicted by bar graphs. Measurements of 10 hsd11b2+/+ (A) WT and 10 hsd11b2−/− (B) mutant zebrafish prior to (control) at 15 min, 30 min, 60 min and 120 min after the stress application. Values are means ± SEM. Means with different letters differ significantly from one another (p < 0.001). Asterisks show statistically significant differences between the two groups (p < 0.001). Holm-Sidak comparison test was applied to identify groups that were significantly different. * p < 0.05, ** p < 0.01. PHENOTYPE:
|

(A) Overview of the locomotor activity of zebrafish larvae of the two genotypes during four alternating phases of 0% and 5% light (139 lux). (B) Distance moved by zebrafish larvae of the two genotypes during four phases of 5% light (139 lux). (C) Distance moved by zebrafish larvae of the two genotypes during four phases of 0% light. (D,E) Percentage of the time spent in the “center” zone as an assessment of thigmotaxis (D) during four phases of 5% light and (E) four phases of 0% light. No statistically significant difference was observed. Holm-Sidak comparison test was applied to identify groups that were significantly different. PHENOTYPE:
|
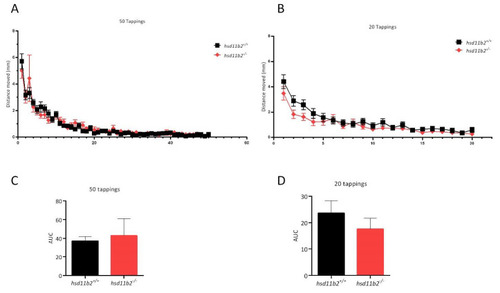
Effect of the VSRA on the escape response of zebrafish larvae. (A) Plots of mean distance moved ± SEM against 50 tapping stimuli at 1 s ISI. (B) Plots of mean distance moved ± SEM against a second sequence of 20 tapping stimuli at 1 s ISI (15 min after the 51st stimulus of the previous sequence). (C,D) Bar graphs of calculated AUC corresponding to the plots of graphs (A,B), respectively. Holm-Sidak comparison test was applied to identify groups that were significantly different. PHENOTYPE:
|

Unillustrated author statements PHENOTYPE:
|