
Image
|
Figure Caption
Figure 8
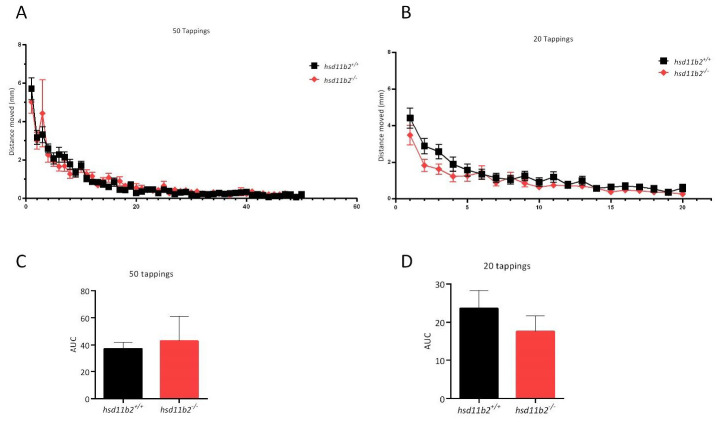
Effect of the VSRA on the escape response of zebrafish larvae. (A) Plots of mean distance moved ± SEM against 50 tapping stimuli at 1 s ISI. (B) Plots of mean distance moved ± SEM against a second sequence of 20 tapping stimuli at 1 s ISI (15 min after the 51st stimulus of the previous sequence). (C,D) Bar graphs of calculated AUC corresponding to the plots of graphs (A,B), respectively. Holm-Sidak comparison test was applied to identify groups that were significantly different.
Figure Data
Acknowledgments
This image is the copyrighted work of the attributed author or publisher, and
ZFIN has permission only to display this image to its users.
Additional permissions should be obtained from the applicable author or publisher of the image.
Full text @ Int. J. Mol. Sci.