
- Title
-
In vivo volumetric imaging of calcium and glutamate activity at synapses with high spatiotemporal resolution
- Authors
- Chen, W., Natan, R.G., Yang, Y., Chou, S.W., Zhang, Q., Isacoff, E.Y., Ji, N.
- Source
- Full text @ Nat. Commun.
|
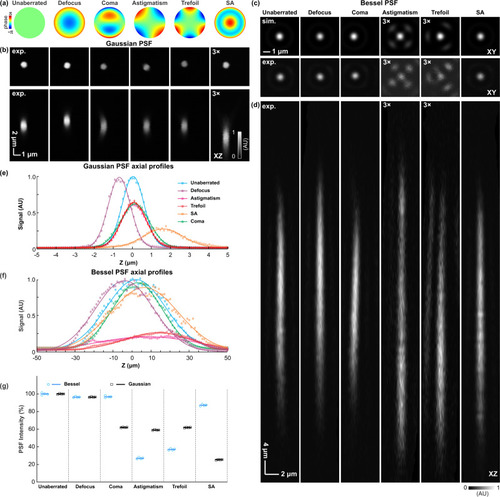
Aberration modes differentially degrade signal and point spread function (PSF) profiles of Gaussian and Bessel foci.
a Zernike modes representing defocus, coma, astigmatism, trefoil, and spherical aberrations (SA), respectively, are introduced to the pupil plane (SLM2). b Lateral (XY) and axial (XZ) PSFs of the Gaussian focus measured using a 0.1-µm-diameter fluorescent bead. c Lateral PSFs of the Bessel focus (upper row) simulated and (lower row) measured using a 0.1-µm-diameter fluorescent bead. d Axial PSF of the Bessel foci measured using a 0.1-µm-diameter fluorescent bead. e, f Axial profiles of the Gaussian and Bessel PSFs, respectively. g Peak signals of Gaussian and Bessel PSFs under different aberration modes. Normalized to the unaberrated PSFs. n = 4 measurements for each aberration mode were acquired from the same bead. Data are presented as dot plots with lines representing mean values. AU arbitrary unit. Source data are available as a source data file. |
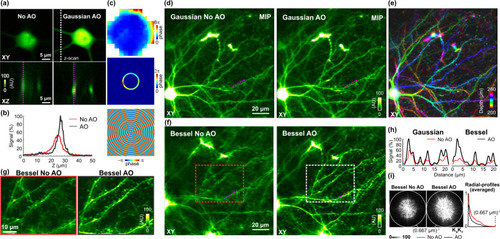
AO improves volumetric imaging of dendritic and synaptic morphology of mouse cortex in vivo.
Primary visual cortex of a Thy1-GFP mouse was imaged through a cranial window in vivo. a Lateral images of a soma (Z = 230 µm) and axial images (along the dashed white line) of nearby dendrites measured without and with AO correction of Gaussian focus. Aberration measurement was performed using the soma. b Signal profiles of dendrites along the dashed purple lines in a. c Wavefront on pupil plane/SLM2 for aberration correction of Gaussian focus, after transmitted through the annular mask, and the computed focal-plane pattern on SLM1 for aberration-corrected Bessel focus. d Mean intensity projections (MIP) of Gaussian imaging stacks from Z = 200 µm to Z = 260 µm without and with AO. e Gaussian imaging stack with AO color-coded by depth. f Bessel images of the same volume as in d, obtained without and with AO. Lateral pixel size: 0.5 µm. g Zoomed-in images of the volume within dashed boxes in f. Lateral pixel size: 0.2 µm. h Signal profiles of dendritic spines along the dashed purple lines in d and f. i Spectral power in the spatial frequency space (KXKY) for Bessel images in g (0.2 µm pixel size) and their radially averaged profiles. Dashed circle: diffraction limit. Post-objective powers: 36 mW for Gaussian and 78 mW for Bessel. Wavelength: 940 nm. AU arbitrary unit. Source data are available as a source data file. |
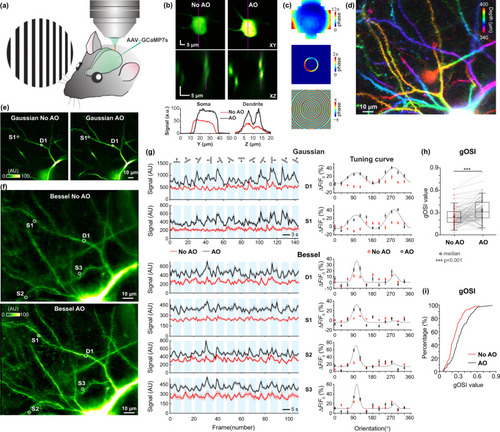
AO enables accurate characterization of orientation-tuning properties of volumes of dendritic spines in awake mouse V1 with in vivo calcium imaging.
a Mouse V1 sparsely expressing the genetically encoded calcium indicator GCaMP7s was imaged through a cranial window in vivo, while the mouse was presented with 12 drifting-grating stimuli, each repeated for 10 trials. b (upper) Lateral images of a soma (Z = 390 µm) and (middle) axial images of its nearby dendrites measured without and with AO correction of Gaussian focus; (lower) Signal profiles along the dashed purple lines. Aberration measurement was performed using the soma. c Wavefront on pupil plane/SLM2 for aberration correction of Gaussian focus, after transmitted through the annular mask, and the computed focal-plane pattern on SLM1 for aberration-corrected Bessel focus. d Gaussian imaging stack from Z = 340 µm to Z = 400 µm color-coded by depth. e A single optical section (Z = 350 µm) image with Gaussian focus, measured without and with AO. f Bessel images of the same volume as in d, obtained without and with AO. g Trial-averaged calcium transients (n = 20 trials) evoked by 12 drifting-grating stimuli and corresponding tuning curves for one dendrite (D1) and three spines (S1–3), measured with Gaussian and Bessel foci, without and with AO, respectively. Only tuning curves that passed the statistical criteria for orientation selectivity were fitted (see “Methods”). Shadows and error bars: SEM. h Global orientation selectivity indices (gOSIs) for n = 91 active spines from the volume imaged by Bessel focus scanning without and with AO. Box-and-whisker plots: center line, median; box upper and lower limits, 25th and 75th percentile; whiskers, SD. Two-sided paired t-test, ***p < 0.001. i Cumulative distributions of gOSI. Kolmogorov–Smirnov test, p < 0.001. Post-objective powers: 108 mW for Gaussian and 97 mW for Bessel. Wavelength: 940 nm. AU arbitrary unit. Source data are available as a source data file. |
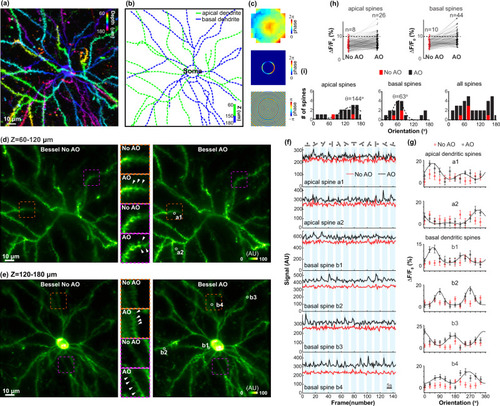
Volumetric imaging of visually evoked glutamate release at apical and basal dendritic spines of a mouse V1 neuron in vivo with AO-corrected Bessel focus.
a Mean intensity projection of the Gaussian imaging stack (128 × 128 × 120 µm3) covering both apical and basal dendritic branches (color-coded by depth). b Apical (green curve) and basal (blue curve) dendritic branches identified from the Gaussian stack. c Wavefront on pupil plane/SLM2 for aberration correction of Gaussian focus, after transmitted through the annular mask, and the computed focal-plane pattern on SLM1 for aberration-corrected Bessel focus. d, e Simultaneously imaged apical and basal dendritic branches of the same volume as in a with Bessel focus before and after AO correction. Insets: zoomed-in views of the structures in dashed boxes. White arrows: spines only resolvable after AO. f Trial-averaged (n = 20 trials) glutamate transients of representative apical and basal dendritic spines (white circles in d and e) evoked by 12 drifting-grating stimuli before and after AO correction and g their corresponding tuning curves averaged across n = 20 trials from a mouse. Shadows (f) and error bars (g): SEM. h Glutamate transient amplitudes (∆F/F0) for 182 apical and 143 basal dendritic spines before and after AO. n: number of spines with ∆F/F0 > 10%. i Preferred orientation distributions of apical, basal, and all dendritic spines measured without (red) and with (black) AO. Dashed curves: Gaussian fits to identify dominant orientations. Post-objective powers: 92 mW for Gaussian and 116 mW for Bessel. Wavelength: 940 nm. AU arbitrary unit. Source data are available as a source data file. |