
- Title
-
Pathophysiological interplay between O-GlcNAc transferase and the Machado-Joseph disease protein ataxin-3
- Authors
- Pereira Sena, P., Weber, J.J., Watchon, M., Robinson, K.J., Wassouf, Z., Hauser, S., Helm, J., Abeditashi, M., Schmidt, J., Hübener-Schmid, J., Schöls, L., Laird, A.S., Riess, O., Schmidt, T.
- Source
- Full text @ Proc. Natl. Acad. Sci. USA
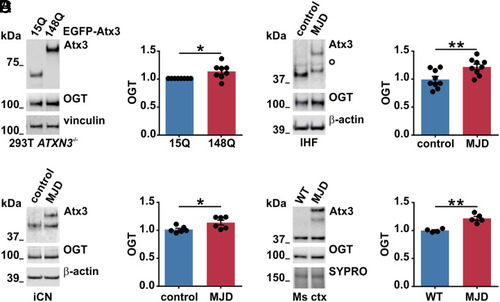
Increased OGT levels in various models of MJD. (A) Western blot analysis of samples from ataxin-3 knockout HEK 293T cells (293T ATXN3−/−) expressing EGFP-tagged wild-type (15Q) or polyQ-expanded (148Q) ataxin-3 revealed increased OGT levels in cells expressing ataxin-3 148Q. Vinculin served as loading control. n = 8, one-sample t test, and P = 0.032. (B) Western blot analysis of different batches of IHF of an MJD patient and a matched control demonstrated increased OGT in MJD samples. White bullet sign (^) indicates unspecific bands, and β-actin served as loading control. n = 9, unpaired t test, and P = 0.007. (C) Western blot analysis of two independent batches of iCN from three MJD patients versus three controls revealed increased levels of OGT in patient-derived iCN. β-actin served as loading control. n = 6, unpaired t test, and P = 0.029. (D) Western blot analysis of mouse cortical samples (Ms ctx) from 5-mo-old wild-type (WT) and CamKII/MJD77 transgenic mice (MJD) demonstrated increased OGT levels in MJD mice. SYPRO Ruby staining served as loading control. n = 4 to 5, unpaired t test, and P = 0.001. Data are represented as means ± SEM, *P ≤ 0.05 and **P ≤ 0.01. |
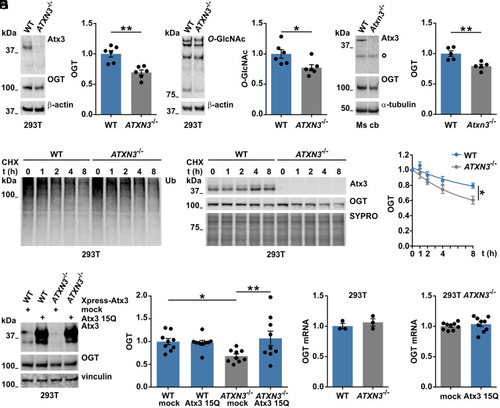
Wild-type ataxin-3 regulates OGT levels. (A and B) Western blot analysis of wild-type (WT) and ataxin-3 knockout (ATXN3−/−) 293T samples for assessing baseline OGT levels. Comparison showed decreased OGT (A) and decreased global O-GlcNAc (B) in 293T ATXN3−/− cells. β-actin served as loading control. (A) n = 6, unpaired t test, and P = 0.001; (B), n = 6, unpaired t test, and P = 0.025. (C) Western blot of cerebellar lysates from 11-mo-old mice showed decreased OGT levels in the cerebellum (Ms cb) of ataxin-3 knockout (Atxn3−/−) mice compared to WT animals. White bullet sign (^) indicates unspecific bands. n = 5, unpaired t test, and P = 0.005. (D) Time-dependent reduction of Ub chains in cells treated with 25 μM of CHX for assessing OGT degradation in presence or absence of ataxin-3. (E) Western blot depicting an increased degradation of OGT in 293T ATXN3−/− compared to WT cells. SYPRO staining served as loading control. n = 3, one phase decay, and P = 0.005 (rejected null hypothesis that one curve fits both datasets). WT versus ATXN3−/− 8 h, unpaired t test, and P = 0.037. (F) Analysis of samples from WT and 293T ATXN3−/− cells transfected with control (mock) or Xpress-tagged wild-type ataxin-3 (Atx3 15Q) vectors revealed a rescue of OGT protein levels in 293T ATXN3−/−cells transfected with ataxin-3 15Q. n = 9, two-way ANOVA with Fisher’s Least Significant Difference (LSD) post hoc analysis, WT mock versus ATXN3−/− mock, P = 0.022; ATXN3−/− mock versus ATXN3−/− 15Q, P = 0.006. (G and H) qRT-PCR for OGT gene expression presented no differences in OGT mRNA levels between the investigated genotypes. G, n = 3, and 293T WT versus ATXN3−/−; H, n = 9, and 293T ATXN3−/− mock versus ATXN3−/− 15Q. Data are represented as mean ± SEM, *P ≤ 0.05 and **P ≤ 0.01. |
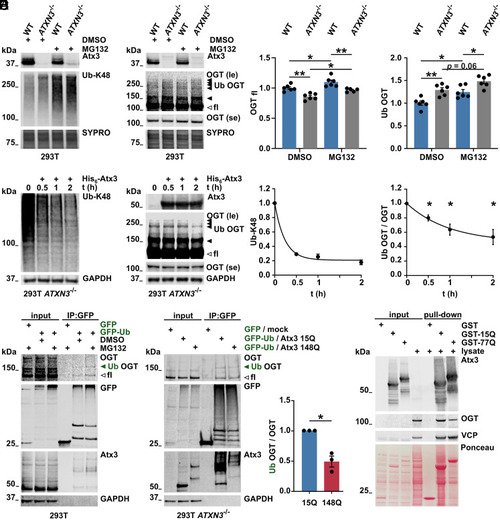
Ubiquitinated OGT is modulated by ataxin-3. (A and B) Western blot of wild-type (WT) and ataxin-3 knockout (ATXN3−/−) 293T samples. Cells were incubated with DMSO or 10 μM of the proteasome inhibitor MG132 for 4 h prior to harvesting. Proteasome inhibition resulted in increased K48-linked ubiquitin chains (A) and increased full-length (unfilled arrowhead) and high–molecular weight OGT bands (B), interpreted as ubiquitinated OGT (Ub OGT, black arrowheads). 293T ATXN3−/− cells revealed stronger accumulation of Ub OGT. SYPRO Ruby staining served as loading control. fl = full-length; le = long exposure; and se = short exposure. n = 6, one-way ANOVA with Sidak’s post hoc analysis. OGTfl in WT DMSO versus ATXN3−/− DMSO, P = 0.001; in WT DMSO versus MG132, P = 0.029; in ATXN3−/− DMSO versus MG132, P = 0.022; in WT MG132 versus ATXN3−/− MG132, P = 0.004; Ub OGT in WT DMSO versus ATXN3−/− DMSO, P = 0.003; in WT DMSO versus MG132, P = 0.013; and in WT MG132 versus ATXN3−/− MG132, P = 0.016. (C) Western blot of deubiquitination assay. Incubation of 293T ATXN3−/− cell lysates with purified His6-Atx3 resulted in decreased K48-linked ubiquitin chains (Ub-K48) and decreased levels of Ub OGT (black arrowheads) over time. Full-length OGT (unfilled arrowhead) remained unchanged. GAPDH served as loading control. n = 3 to 4, one-sample t test, and Ub OGT in 30, 60, and 120 min incubation with His6-Atx3, P = 0.018, P = 0.018, and P = 0.021 respectively. (D) Western blot of immunoprecipitated GFP and GFP-Ub, probed for OGT. GFP constructs were expressed in WT 293T cells for further lysis and immunoprecipitation (IP) of GFP. Cells were incubated with DMSO or 10 μM MG132 for 4 h prior to lysis. IP of GFP-Ub showed increased full-length and high–molecular weight OGT (Ub OGT, green arrowhead) in cells treated with MG132. Ataxin-3 was used as positive control for GFP-Ub–positive proteins. GAPDH served as loading control. le = long exposure and se = short exposure. (E) Western blot of immunoprecipitated GFP and GFP-Ub from cells expressing Atx3 15Q or 148Q for analyzing Ub OGT. 293T ATXN3−/− cells were transfected with GFP/empty vector (mock) or GFP-Ub/Atx3 (15Q or 148Q) and treated with 10 μM MG132 for 4 h prior to lysis. IP of GFP probed for OGT confirmed the presence of full-length and Ub OGT (green arrowhead) among GFP-Ub–positive proteins. Ub OGT band was weaker in the IP from cells expressing Atx3 148Q. Ataxin-3 was used as positive control for GFP-Ub–positive proteins. GAPDH served as loading control. n = 3, one-sample t test, and P = 0.029. (F) GST pull-down assay for analyzing interaction between ataxin-3 and OGT. GST-tagged WT (GST-15Q) and polyQ-expanded (GST-77Q) ataxin-3 were isolated and incubated with 293T cell lysates. Western blot analysis revealed interaction of both ataxin-3 variants with OGT. GST empty vector was used as negative control for protein interaction and the valosin-containing protein (VCP) was employed as positive control. Total protein was stained with Ponceau S. Data are represented as means ± SEM, *P ≤ 0.05, and **P ≤ 0.01. |

OGT knockdown reduces soluble and aggregated forms of polyQ-expanded ataxin-3. (A) Western blot demonstrated OGT down-regulation by the OGT-targeting esiRNAs (esiOGT). 293T ATXN3−/− cells were transfected with EGFP-tagged wild-type (15Q) or polyQ-expanded (148Q) ataxin-3 and control (esiLUC) or esiOGT. β-actin served as loading control. n = 6 and one-sample t test; in 15Q esiLUC versus 15Q esiOGT, P = 0.0004; and in 148Q esiLUC versus 148Q esiOGT, P = 0.005. (B) Samples probed for O-GlcNAc confirmed the decreased O-GlcNAcylation upon OGT knockdown. n = 6 and one-sample t test; in 15Q esiLUC versus 15Q esiOGT, P = 0.076; and in 148Q esiLUC versus 148Q esiOGT, P = 0.001. (C) OGT knockdown reduced full-length (fl, blue and red arrowheads) and fragments (blue and red unfilled arrowheads) of both Atx3 15Q and 148Q, and reduced ataxin-3 148Q aggregates, as evidenced by the stacking gel (sg). Vinculin served as loading control. n = 6 and one-sample t test; in 15Q esiLUC versus 15Q esiOGT, P = 0.037; and in 148Q esiLUC versus 148Q esiOGT, P = 0.012. (D) Filter retardation analysis confirmed a decreased amount of Atx3 148Q aggregates upon OGT knockdown. n = 6, one-sample t test, and P = 0.031. (E) Fluorescence microscopy analysis also demonstrated a reduced number of aggregates (highlighted by arrowheads) under OGT knockdown (630× magnification). Scale bar, 20 μm. Data shows the percentage of aggregates in GFP-positive (EGFP+) cells. n = 4, paired t test, and P = 0.038. (F) PrestoBlue assay of 293T ATXN3−/− cells transfected with Atx3 15Q or 148Q and esiLUC or esiOGT demonstrated an OGT knockdown-dependent rescue of the cell viability in cells expressing Atx3 148Q. Normalization was done to the mean of wild-type control group (15Q esiLUC). n = 6 and repeated measures one-way ANOVA with Tukey’s post hoc test; in 15Q esiLUC versus 148Q esiLUC, P = 0.033; and in148Q esiLUC versus 148Q esiOGT, P = 0.006. Data are represented as means ± SEM *P ≤ 0.05, **P ≤ 0.01, and ***P ≤ 0.001. |

Pharmacological inhibition of OGT reduces polyQ-expanded ataxin-3 levels and aggregates and increases autophagy. (A) Western blot analysis of protein extracts revealing that full-length Atx3 148Q (fl148Q, red arrowhead) was reduced upon OGT inhibition, while Atx3 15Q (fl15Q, blue arrowhead) remained unchanged. GAPDH served as loading control. n = 5 and one-sample t test; in 148Q DMSO versus 148Q OSMI-1, P = 0.044. (B) Filter retardation analysis of samples used in A, showing decreased aggregation of Atx3 148Q upon OSMI-1 treatment. n = 5, one-sample t test, and P = 0.010. (C) Cell-viability analysis of IHF derived from one control and one MJD patient demonstrating impaired viability of the MJD line, which was rescued by a 24 h treatment with 10 μM OSMI-1. n = 5, control DMSO versus control MJD, one-sample t test, and P = 0.021; in MJD DMSO versus MJD OSMI-1, paired t test and P = 0.0023. (D) Western blot for analysis of autophagy markers LC3B-II and p62 in 293T samples obtained after 10 μM OSMI-1 treatment plus 50 nM of the autophagy inhibitor BafA1 4 h before harvesting. Elevated LC3B-II and p62 levels upon OSMI-1 and BafA1 treatment suggest increased autophagic flux. β-actin served as loading control. - BafA1 = without BafA1; and + BafA1 = with BafA1. n = 3 and two-way ANOVA with Sidak’s post hoc test; in 10 μM OSMI-1 BafA1 versus DMSO BafA1, P = 0.0001 for p62 and P = 0.001 for LC3-II. (E) Western blot of iCN from MJD patients showing the reduction of global O-GlcNAc and of soluble ataxin-3 in samples treated with OSMI-1. Treatment of iCN derived from three MJD patients with 10 μM OSMI-1 for 24 h or 72 h, or 30 μM OSMI-1 for 24 h resulted in decreased polyQ-expanded ataxin-3 (Atx3 flexp, red arrowhead) in all three conditions compared to DMSO control (0 μM OSMI-1), whereas a significant reduction of WT Atx3 (Atx3 flwt, blue arrowhead) was only achieved with 30 μM OSMI-1 for 24 h GAPDH served as loading control. n = 3 and one-sample t test; in Atx3 flwt. 0 versus 30 μM OSMI-1, P = 0.0003; in Atx3 flexp 0 versus 10 μM OSMI-1 24 h, P = 0.0008; in Atx3 flexp 0 versus 10 μM OSMI-1 72 h, P = 0.016; and in Atx3 flexp 0 versus 30 μM OSMI-1 24 h, P = 0.003. (F) Filter retardation analysis of samples used in E revealing a reduction of ataxin-3 protein aggregates upon OSMI-1 treatment. n = 3 and one-sample t test; in 0 versus 10 μM OSMI-1 24 h, P = 0.043; in 0 versus 10 μM OSMI-1 72 h, P = 0.026; and in 0 versus 30 μM OSMI-1, P = 0.046. Data are represented as means ± SEM *P ≤ 0.05, **P ≤ 0.01, ***P ≤ 0.001, and ns = not significant. |
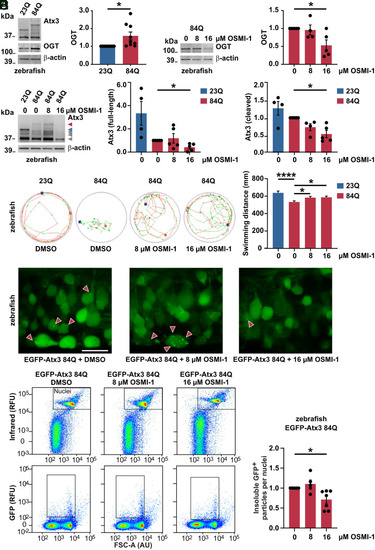
Counteracting increased OGT via its pharmacological inhibition reduces polyQ-expanded ataxin-3 levels and aggregates, alleviating motor phenotype in MJD zebrafish model. (A) Western blot of samples from MJD zebrafish larvae (84Q) and its wild-type control (23Q), depicting a baseline increase of OGT in the ataxin-3 84Q fish. β-actin served as loading control. n = 9 to 10, one-sample t test, and P = 0.028. (B) Western blot demonstrating the reduction of OGT upon 16 μM OSMI-1 treatment of Atx3 84Q zebrafish. β-actin served as loading control. n = 5 and one-sample t test; in 0 versus 16 μM OSMI-1, P = 0.036. (C) Treatment of Atx3 84Q zebrafish with 16 μM OSMI-1 also reduced Atx3 full-length (red arrowhead) and cleavage products (gray arrowheads), as demonstrated on Western blot. β-actin served as loading control. n = 4 to 5, one-sample t test; in Atx3 full-length 0 versus 16 μM OSMI-1, P = 0.014; and in Atx3 cleaved 0 versus 16 μM OSMI-1, P = 0.011. (D) Representative images of the total distance swum on a tracking system by the Atx3 23Q and 84Q DMSO-treated transgenic zebrafish and the Atx3 84Q OSMI-1-treated fish at the concentrations of 8 μM and 16 μM. Images revealed a baseline impaired swimming pattern for the 84Q fish (DMSO) when compared to the 23Q fish and an improvement of the motor function in the 84Q OSMI-1-treated fish. The graph displays the quantification of the total swum distance of the transgenic zebrafish in all conditions depicted in the images. n = 184 (23Q), 247 (84Q 0 μM), 210 (84Q 8 μM), 246 (84Q 16 μM); one-way ANOVA with Dunett’s post hoc test; in 23Q versus 84Q DMSO (0 μM OSMI-1), P < 0.0001; in 84Q 0 versus 8 μM OSMI-1, P = 0.049; and in 84Q 0 versus 16 μM, P = 0.022. (E) Confocal imaging of the Atx3 84Q zebrafish spinal cord demonstrating the reduction of ataxin-3 aggregates (red arrowheads) upon OSMI-1 treatment at 16 μM (400× magnification). Scale bar, 15 μm. (F) Flow cytometric analysis of dissociated zebrafish cells expressing EGFP-tagged Atx3 84Q demonstrated the reduction of ataxin-3 aggregates (insoluble GFP+ particles) upon 16 μM OSMI-1 treatment. Nuclei of live cells were stained and identified based on the intensity of infrared fluorescence. RFU, relative fluorescence units; FSC-A (AU), forward scatter area, arbitrary unit. The graph displays the quantification of ataxin-3 aggregates at 0 μM (DMSO), 8 μM, and 16 μM OSMI-1 treatment. n = 5 to 7, one-sample t test, and P = 0.018. Data are represented as means ± SEM, *P ≤ 0.05, and ****P ≤ 0.0001. |

Schematic representation of the proposed interplay between ataxin-3 and OGT in protein clearance. (A) Under physiological conditions, wild-type ataxin-3 (Atx3wt) serves as a DUB to OGT, partly rescuing the latter from proteasomal degradation and thereby indirectly lowering autophagic flux (20). This counteracts the positive autophagy regulation by ataxin-3 (64). The equilibrium between positive and negative feedback of wild-type ataxin-3 toward autophagy allows a proper degradation of misfolded proteins and compromised organelles in a healthy cellular context. (B) In MJD, polyQ-expanded ataxin-3 (Atx3ex) presents enhanced DUB activity toward OGT, which culminates in reduced degradation and thus increased OGT protein levels. This process leads to a further suppression and impairment of autophagy by preventing autophagosome–lysosome fusion (20), ultimately resulting in accumulation of toxic soluble and aggregated forms of polyQ-expanded ataxin-3. |