
|
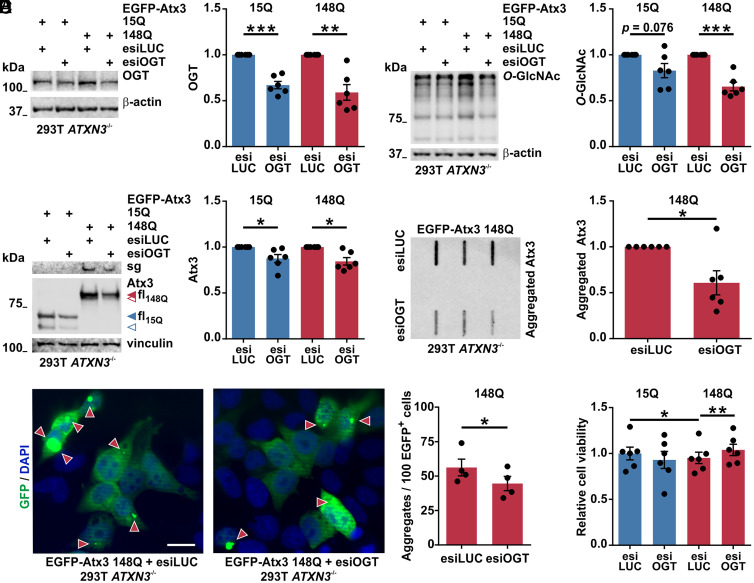
Fig. 4
OGT knockdown reduces soluble and aggregated forms of polyQ-expanded ataxin-3. (A) Western blot demonstrated OGT down-regulation by the OGT-targeting esiRNAs (esiOGT). 293T ATXN3−/− cells were transfected with EGFP-tagged wild-type (15Q) or polyQ-expanded (148Q) ataxin-3 and control (esiLUC) or esiOGT. β-actin served as loading control. n = 6 and one-sample t test; in 15Q esiLUC versus 15Q esiOGT, P = 0.0004; and in 148Q esiLUC versus 148Q esiOGT, P = 0.005. (B) Samples probed for O-GlcNAc confirmed the decreased O-GlcNAcylation upon OGT knockdown. n = 6 and one-sample t test; in 15Q esiLUC versus 15Q esiOGT, P = 0.076; and in 148Q esiLUC versus 148Q esiOGT, P = 0.001. (C) OGT knockdown reduced full-length (fl, blue and red arrowheads) and fragments (blue and red unfilled arrowheads) of both Atx3 15Q and 148Q, and reduced ataxin-3 148Q aggregates, as evidenced by the stacking gel (sg). Vinculin served as loading control. n = 6 and one-sample t test; in 15Q esiLUC versus 15Q esiOGT, P = 0.037; and in 148Q esiLUC versus 148Q esiOGT, P = 0.012. (D) Filter retardation analysis confirmed a decreased amount of Atx3 148Q aggregates upon OGT knockdown. n = 6, one-sample t test, and P = 0.031. (E) Fluorescence microscopy analysis also demonstrated a reduced number of aggregates (highlighted by arrowheads) under OGT knockdown (630× magnification). Scale bar, 20 μm. Data shows the percentage of aggregates in GFP-positive (EGFP+) cells. n = 4, paired t test, and P = 0.038. (F) PrestoBlue assay of 293T ATXN3−/− cells transfected with Atx3 15Q or 148Q and esiLUC or esiOGT demonstrated an OGT knockdown-dependent rescue of the cell viability in cells expressing Atx3 148Q. Normalization was done to the mean of wild-type control group (15Q esiLUC). n = 6 and repeated measures one-way ANOVA with Tukey’s post hoc test; in 15Q esiLUC versus 148Q esiLUC, P = 0.033; and in148Q esiLUC versus 148Q esiOGT, P = 0.006. Data are represented as means ± SEM *P ≤ 0.05, **P ≤ 0.01, and ***P ≤ 0.001.