
- Title
-
Proper Balance of Small GTPase rab10 Is Critical for PGC Migration in Zebrafish
- Authors
- Mo, C., Li, W., Jia, K., Liu, W., Yi, M.
- Source
- Full text @ Int. J. Mol. Sci.
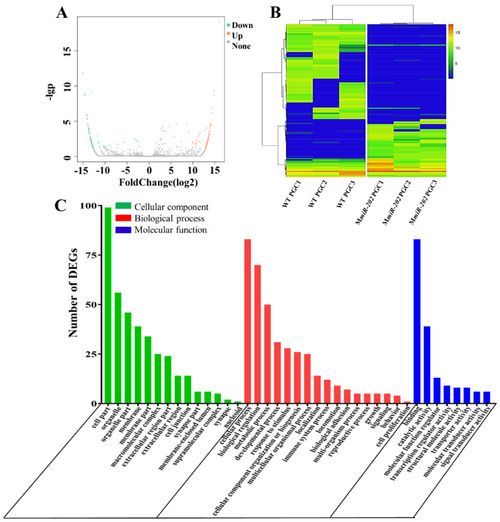
The expression pattern and GO annotation of DEGs. (A) Volcano plot of DEGs in WT and MmiR-202 PGCs. The up-regulated and down-regulated DEGs were respectively shown as red and green dots. (B) Heatmap for the cluster analysis of DEGs in WT and MmiR-202 PGCs. (C) The Gene Ontology annotation of all DEGs. The X-axis represents the 39 subcategories. The Y-axis shows the number of DEGs. |
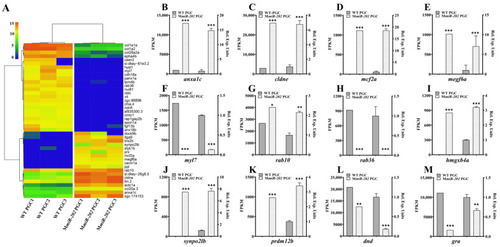
Heatmap of representative DEGs related to cell migration and verification of the expression patterns by qPCR analysis. (A) Two-dimensional hierarchical cluster of DEGs associated with cell migration. (B–M) Validation of the transcriptome by qRT-PCR analysis of representative genes including (B) anxa1c, (C) cldne, (D) mcf2a, (E) megf6a, (F) myl7, (G) rab10, (H) rab36, (I) hmgxb4a, (J) synpo2lb, (K) prdm12b, (L) dnd and (M) gra. The FPKM values (left) and the relative expression levels of qPCR (right) are shown. (B–G) The results were representative of more than three independent experiments in triplicate. Three reference genes ef1a, β-actin and rpl13a were used in every PCR examination to normalize gene expression levels with 2-∆∆Ct method. The statistics were calculated and analyzed by Student’s t-test, * p < 0.05; ** p < 0.01; *** p < 0.001. |
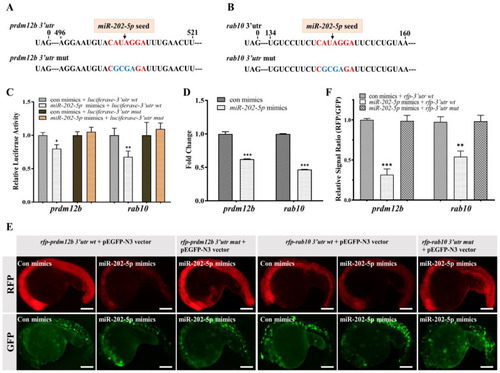
miR-202-5p directly regulates prdm12b and rab10. (A,B) The sequence information of the 3′utr of prdm12b and rab10. The canonical miR-202-5p binding sites and its mutant were shown in red and blue, respectively. (C) Relative luciferase activity in HEK293T cells transfected with psiCHECK2-3′utr wt (prdm12b or rab10) or psiCHECK2-3′utr mut (prdm12b or rab10) in the presence of control mimics (con mimics) or miR-202-5p mimics. (D) qRT-PCR analysis of prdm12b and rab10 mRNA in 24hpf embryos injected with control or miR-202-5p mimics. (E) The representative images of embryos co-injected with mRNAs of rfp-prdm12b 3′utr wt, rfp-prdm12b 3′utr mut, rfp-rab10 3′utr wt or rfp-rab10 3′utr mut in the presence of control or miR-202-5p mimics. All embryos were co-injected with pEGFP-N3 vector as a control. (F) The relative signal ratio of RFP/GFP in the experiment presented in (E). (C,D,F) The results were representative of more than three independent experiments in triplicate. β-actin was used as an internal control to normalize gene expression levels with 2-∆∆Ct method * p < 0.05; ** p < 0.01; *** p < 0.001. |
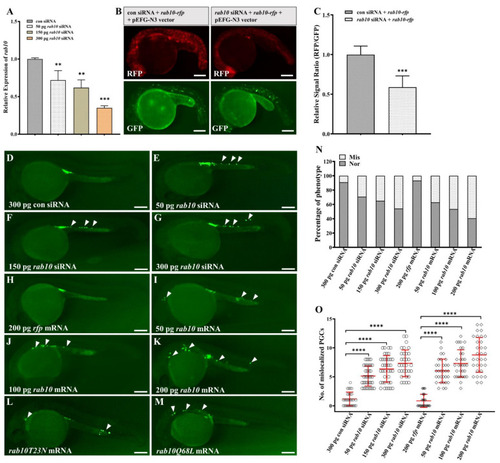
Disruption of rab10 balance leads to PGC mislocalization. (A) qRT-PCR analysis of rab10 mRNA in 24hpf embryos injected with control siRNA (con siRNA) or gradient rab10 siRNA (50, 150, 300 pg). (B) Co-injection of rab10 siRNA decreased expression of RFP in embryos injected with rab10-rfp mRNA compared to embryos co-injected with control siRNA. All embryos were co-injected with pEGFP-N3 vector as a control. (C) Quantitative representation of the normalized signal intensity in the experiment presented in (B). (D–M) Representative images of embryos injected with 300 pg con siRNA (D), 50 pg rab10 siRNA (E), 150 pg rab10 siRNA (F), 300 pg rab10 siRNA (G), 200 pg rfp mRNA (H), 50 pg rab10 mRNA (I), 100 pg rab10 mRNA (J), 200 pg rab10 mRNA (K), rab10T23N mRNA (L), and rab10Q68L mRNA (M). Arrowheads indicate mislocalized PGCs. (N) The percentage of PGC phenotypes in embryos with (D–K). (O) The number of mislocalized PGCs in each embryo with the experiment presented in (D–K). The average number of mislocalized PGCs were showed in red line by mean ± sd. (A,C,N,O) The results were representative of more than three independent experiments in triplicate. β-actin was used as an internal control to normalize gene expression levels with 2−∆∆Ct method. ** p < 0.01; *** p < 0.001, **** p < 0.0001. Scale bar, 100 µm. |
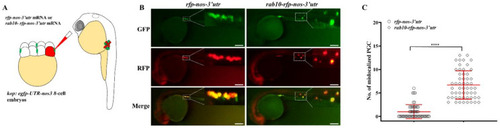
PGC-specific overexpression of rab10 leads to PGC mislocalization. (A) rab10-rfp-nos-3′utr mRNA was injected into 8-cell embryos of kop: egfp-UTR-nos3 lines. (B) Representative images of PGCs in embryos injected with rfp-nos mRNA or rab10-rfp-nos-3′utr at prim 5 stage. (C) The number of mislocalized PGCs in each embryo injected with rfp-nos mRNA or rab10-rfp-nos-3′utr at prim 5 stage. (C) The results were representative of more than three independent experiments in triplicate. The average number of mislocalized PGCs were showed in red line by mean ± sd. **** p < 0.0001. Scale bar, 100 µm. |
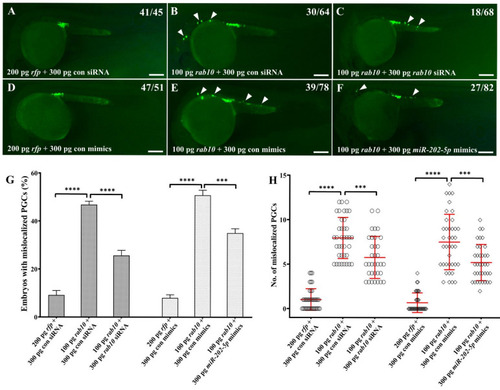
Overexpression of miR-202-5p partially rescues PGC migration in embryos overexpressing rab10. (A–F) Representative images of PGCs in embryos injected with 200 pg rfp mRNA and 300 pg control siRNA or control mimics (A,D), 100 pg rab10 mRNA and 300 pg control siRNA or control mimics (B,E), 100 pg rab10 mRNA and 300 pg rab10 siRNA or miR-202-5p mimics (C,F). Arrowheads indicate mislocalized PGCs. The corresponding phenotypes in different groups of embryos were shown in the upper right of the panels (A–F). (G) The percentage of embryos with mislocalized PGCs in (A–F). (H) The number of mislocalized PGCs in each embryo in (A–F). (G,H) The results were representative of more than three independent experiments in triplicate. The average number of mislocalized PGCs were showed in red line by mean ± sd. *** p < 0.001, **** p < 0.0001. Scale bar, 100 µm. |
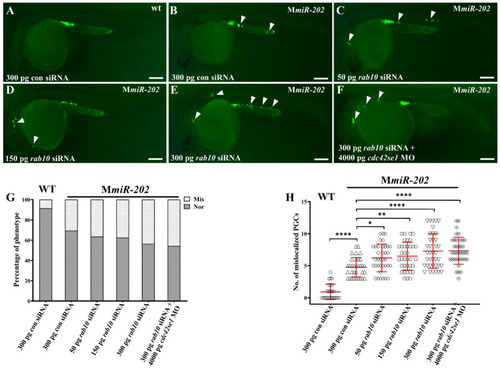
rab10 siRNA and cdc42se1 MO failed to rescue mislocalized PGCs in embryos caused by maternal absence of miR-202-5p. (A) Representative images of PGCs in WT embryos injected with 300 pg con siRNA; (A) Representative images of PGCs in Mmir-202 embryos injected with 300 pg con siRNA (B), 50 pg rab10 siRNA (C), 150 pg rab10 siRNA (D), 300 pg rab10 siRNA (E), and 300 pg rab10 siRNA + 4000 pg cdc42se1 MO (E). Arrowheads indicate mislocalized PGCs. (G) The percentage of embryos with mislocalized PGCs with (A–F). The genotypes of the embryos were shown upper right in each panel. (H) The number of mislocalized PGCs in each embryo in the experiment presented in (A–F). (G,H) The results were representative of more than three independent experiments in triplicate. The average number of mislocalized PGCs were showed in red line by mean ± sd. * p < 0.05, ** p < 0.01, **** p < 0.0001. Scale bar, 100 µm. |