
|
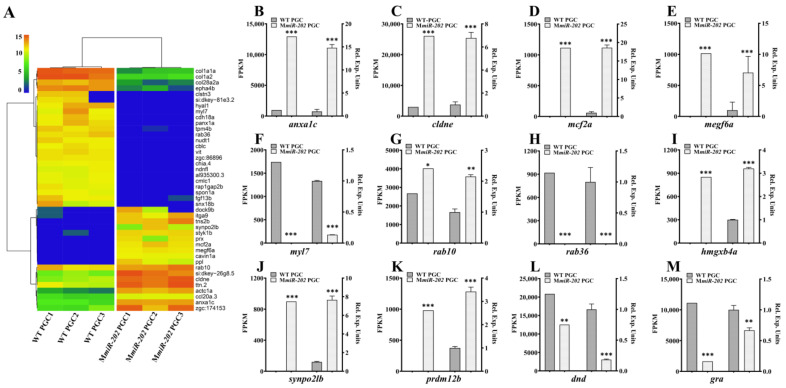
Figure 2
Heatmap of representative DEGs related to cell migration and verification of the expression patterns by qPCR analysis. (A) Two-dimensional hierarchical cluster of DEGs associated with cell migration. (B–M) Validation of the transcriptome by qRT-PCR analysis of representative genes including (B) anxa1c, (C) cldne, (D) mcf2a, (E) megf6a, (F) myl7, (G) rab10, (H) rab36, (I) hmgxb4a, (J) synpo2lb, (K) prdm12b, (L) dnd and (M) gra. The FPKM values (left) and the relative expression levels of qPCR (right) are shown. (B–G) The results were representative of more than three independent experiments in triplicate. Three reference genes ef1a, β-actin and rpl13a were used in every PCR examination to normalize gene expression levels with 2-∆∆Ct method. The statistics were calculated and analyzed by Student’s t-test, * p < 0.05; ** p < 0.01; *** p < 0.001.