
- Title
-
Synthesis and Biological Evaluation of a c(RGDyK) Peptide Conjugate of SRPIN803
- Authors
- Leonidis, G., Dalezis, P., Trafalis, D., Beis, D., Giardoglou, P., Koukiali, A., Sigala, I., Nikolakaki, E., Sarli, V.
- Source
- Full text @ ACS Omega
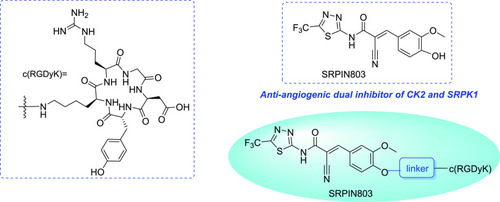
Structure of SRPIN803-c(RGDyK) conjugates. |
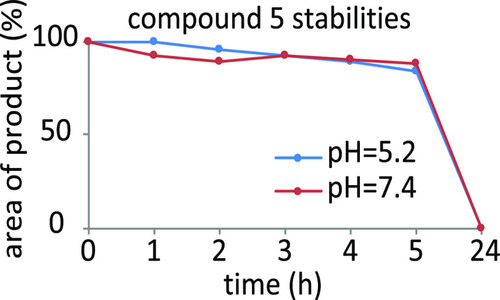
Chemostability of 5 by LC-MS analysis (results are presented as mean ± SD for three independent experiments). |
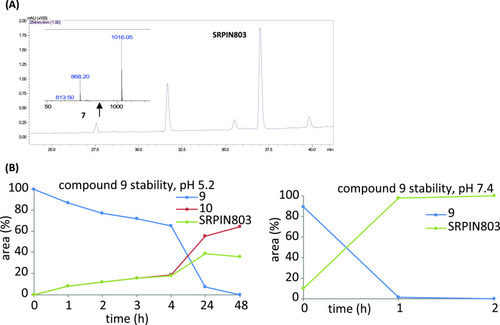
(A) LC/MS analysis of reaction mixture for the formation of 7. Compound 7 ESI-MS m/z for C42H49F3N13O12S [M + H]+ calcd 1016.3296, found 1016.05. (B) Chemostability of 9 by LC-MS analysis. Results are presented as mean ± SD for three independent experiments. |
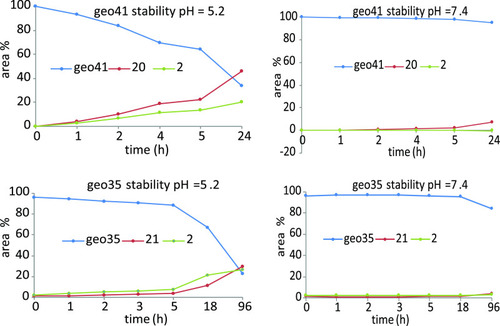
Chemostability of geo41 and geo35 by LC-MS analysis. Results are presented as mean ± SD for three independent experiments. |
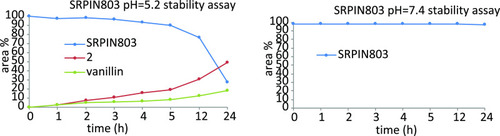
Chemostability of SRPIN803 by LC-MS analysis. Results are presented as mean ± SD for three independent experiments. |
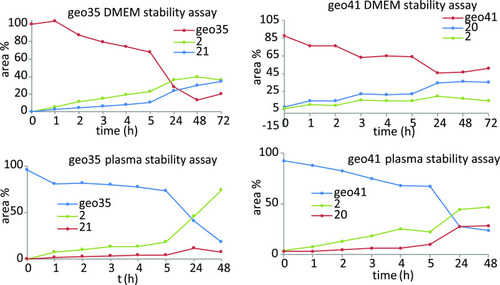
Biostability assays of geo41 and geo35 by LC-MS analysis. Results are presented as mean ± SD for three independent experiments. |
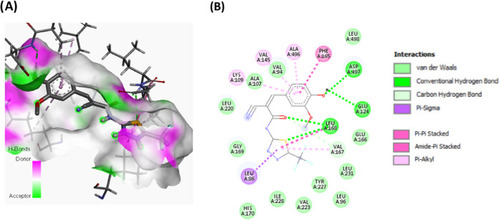
(A) Docking pose of SRPIN803 in SRPK1 binding site. (B) 2D plot of interactions between SRPIN803 and key residues of SRPK1 generated by BIOVIA Discovery Studio visualizer. Molecular interactions—hydrogen and hydrophobic bonds are indicated by green and pink/purple dashed lines. |
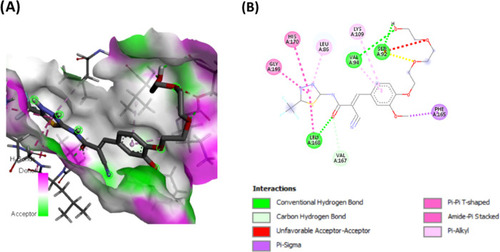
(A) Docking pose of geo33 in SRPK1 binding site. (B) 2D plot of interactions between geo33 and key residues of SRPK1 generated by BIOVIA Discovery Studio visualizer. Molecular interactions—hydrogen, hydrophobic bonds and unfavorable acceptor–acceptor are indicated by green, pink/purple and red dashed lines. |
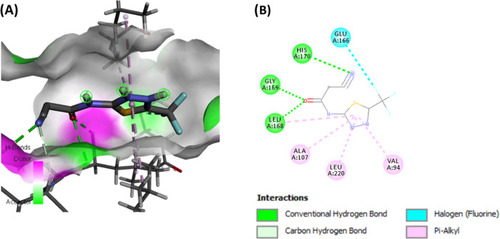
(A) Docking pose of 2 in SRPK1 binding site. (B) 2D plot of interactions between 2 and key residues of SRPK1 generated by BIOVIA Discovery Studio visualizer. Molecular interactions—hydrogen and hydrophobic bonds and halogen are indicated by green, pink/purple, and light blue dashed lines, respectively. |
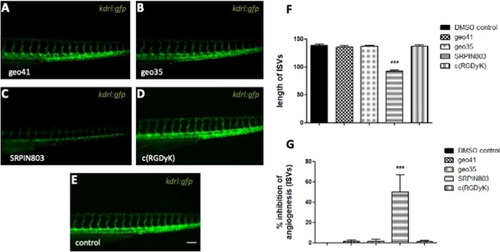
In vivo screening reveals SRPIN803 as a master inhibitor of angiogenesis upon zebrafish treatment assay. (A–E) Fluorescence microscopy images of representative compound treated from 24hpf, and DMSO-treated control 72hpf Tg(kdrl:gfp) embryos. Scale bar, 100 μm. (F) The total length of 10 ISVs per embryo was measured and presented. SRPIN803 shows statistically significant inhibition of ISVs, while the other tested compounds had no effect at the tested concentration. (G) The percentage of inhibition of angiogenesis was calculated compared to DMSO-treated controls for each compound. Data are expressed as mean + SEM (n = 20/group). p*** < 0.001. |
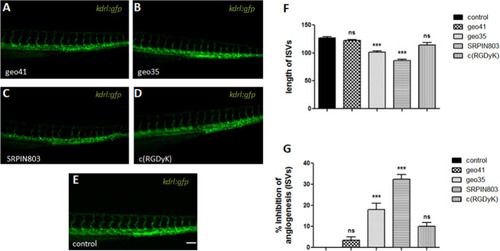
In vivo zebrafish screening unravels two inhibitors of angiogenesis. (A–D) Fluorescence microscopy images of representative injected and uninjected control (E) at 72hpf of Tg(kdrl:gfp) embryos. Scale bar, 100 μm. (F) The total length of 10 ISVs per embryo was measured and presented. Both geo35 and SRPIN803 block angiogenesis, with geo35 exhibiting a milder effect than SRPIN803. (G) The percentage of the inhibition of angiogenesis was calculated compared to uninjected sibling controls for each compound. Data are expressed as mean + SEM (n = 30/group). p*** < 0.001. |