
IMAGE
Fig. 11
- ID
- ZDB-IMAGE-221210-25
- Publication
- Leonidis et al., 2021 - Synthesis and Biological Evaluation of a c(RGDyK) Peptide Conjugate of SRPIN803
- All Figures
- Figures for Leonidis et al., 2021
Image
|
Figure Caption
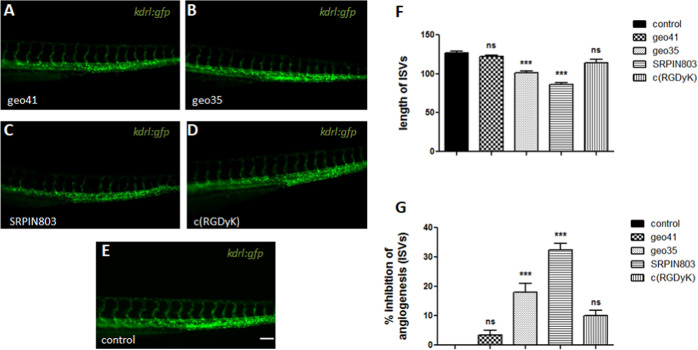
Fig. 11
In vivo zebrafish screening unravels two inhibitors of angiogenesis. (A–D) Fluorescence microscopy images of representative injected and uninjected control (E) at 72hpf of Tg(kdrl:gfp) embryos. Scale bar, 100 μm. (F) The total length of 10 ISVs per embryo was measured and presented. Both geo35 and SRPIN803 block angiogenesis, with geo35 exhibiting a milder effect than SRPIN803. (G) The percentage of the inhibition of angiogenesis was calculated compared to uninjected sibling controls for each compound. Data are expressed as mean + SEM (n = 30/group). p*** < 0.001.
Acknowledgments
This image is the copyrighted work of the attributed author or publisher, and
ZFIN has permission only to display this image to its users.
Additional permissions should be obtained from the applicable author or publisher of the image.
Full text @ ACS Omega