
- Title
-
Dissecting VEGF-induced acute versus chronic vascular hyperpermeability: Essential roles of dimethylarginine dimethylaminohydrolase-1
- Authors
- Wang, Y., Angom, R.S., Kulkarni, T.A., Hoeppner, L.H., Pal, K., Wang, E., Tam, A., Valiunas, R.A., Dutta, S.K., Ji, B., Jarzebska, N., Chen, Y., Rodionov, R.N., Mukhopadhyay, D.
- Source
- Full text @ iScience
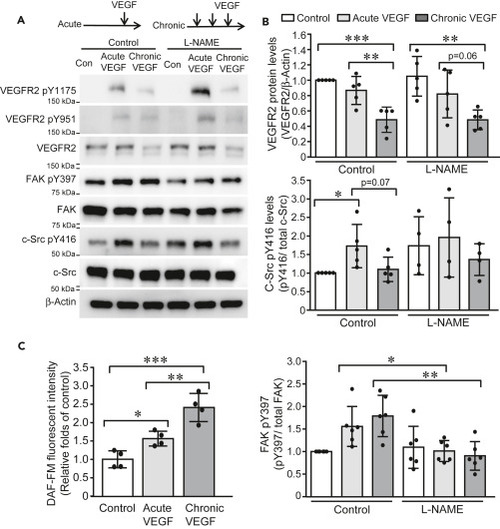
Figure 1. Acute and chronic VEGF exposures induce distinct pattern of signaling cascade activation (A and B) HUVECs were cultured in low-serum EMB for 4 h and then exposed to single stimulus of VEGF (10 ng/mL) and three stimuli of VEGF (10 ng/mL) with 30-min intervals, respectively. Cell lysates were collected 10 min after VEGF stimulation and subjected to western blotting (A). Band intensities were analyzed and compared (N = 5 for each group) (B). (C) HUVECs were labeled with DAF-FM (2.5 μM) and then exposed to acute and chronic VEGF stimulation, respectively. DAF-FM fluorescence was measured at Excitation/Emission of 495/515 nm and expressed as relative folds of control group. Data is representative of 3 independent experiments and expressed as mean ± SD. ∗, p<0.05, ∗∗, p<0.01, ∗∗∗, p<0.001. |

Figure 2. Quantification of the spatial distribution of vascular permeability induced by acute and chronic VEGF in zebrafish (A) Heat-inducible VEGF transgenic zebrafish (pKTol2H70-mC-hVEGF-gcG) (Hoeppner et al., 2012), in which VEGF expression is driven by a heat-inducible HSP70 promoter and preceded by an upstream floxed mCherry gene, were bred with Tg(fli:EGFP) zebrafish (Lawson and Weinstein, 2002) to generate the double transgenic zebrafish Tg(pKTol2H70-mC-hVEGF-gcG);Tg(fli:EGFP). F1 progenies were used to identify true transgenics and the lines with low background but high heat-shock induction of mCherry were selected. (B) In the selected double transgenic zebrafish lines, Cre mRNA was microinjected into F1 single cell embryos to excise the mCherry gene, resulting in expression of hVEGF on induction of the HSP70 promoter. At 3-days postfertilization (3-dpf), zebrafish embryos were anaesthetized and microinjected with Texas Red-dextran (70 kDa) to the pericardium. VEGF-induced vascular hyperpermeability in zebrafish was examined at base line (no exposure to heat shock), upon acute (37°C for 30 min) and chronic (3 times of 37°C for 30 min with 30 min intervals at 28.5°C) exposure to heat shock as demonstrated. (C) An image processing method was developed to analyze the vascular permeability: (1) Maximum intensity projection image was first generated, and then (2) binary mask extracted from green channel was generated. (3) Binary image constituting of red pixels was obtained after masking original image (1) by green channel (2). In addition to vascular leakiness, the resulting red pixels (Texas Red-dextran at 70 kDa) represent leakiness and signals from autofluorescence, caudal veins and arteries, and somites. (4) Pixels corresponding to autofluorescence as well as caudal arteries and veins and (5) somites were highlighted and eliminated. (6) The final processed image containing pixels show the total leakiness. (D and E) Images of whole mount imaging (D) and different regions of zebrafish (E) were acquired immediately after heat-shock using a Zeiss LSM 880 confocal microscope using standard FITC and dsRed filter sets. (F) Using our new algorithm, the vascular permeability of anterior and posterior regions of trunks and tail regions were analyzed and compared. ∗∗∗, p<0.001. Zebrafish numbers in each group are presented in the scatter plot. Data is expressed as mean ± SD. Scale bar, 200 μm in (C, D, and E) |

Figure 3. DDAH1 mediates acute and chronic VEGF-mediated signaling pathways in ECs (A) HUVECs were infected with lentivirus expressing of control shRNA and DDAH1 shRNA, cultured in low-serum EMB for 4 h and then exposed to stimuli of acute (single stimulus of VEGF at 10 ng/mL) and chronic VEGF (three stimuli of VEGF at 10 ng/mL with 30 min intervals), respectively. Proteins were collected 10 min after VEGF stimulation and analyzed with western blotting (A). (B) Control and DDAH1 knockdown HUVECs were labeled with DAF-FM (2.5 μM) and then exposed to acute and chronic VEGF stimulation, respectively. DAF-FM fluorescence was measured at Excitation/Emission of 495/515 nm. N numbers are presented in the scatter plot. Data is expressed as mean ± SD. ∗∗∗, p < 0.001. (C) HUVECs were infected with retrovirus expressing of LacZ and DDAH1, cultured in low-serum EMB and then exposed to acute and chronic VEGF stimulation. Proteins were collected 10 min after VEGF stimulation and analyzed with western blotting. |
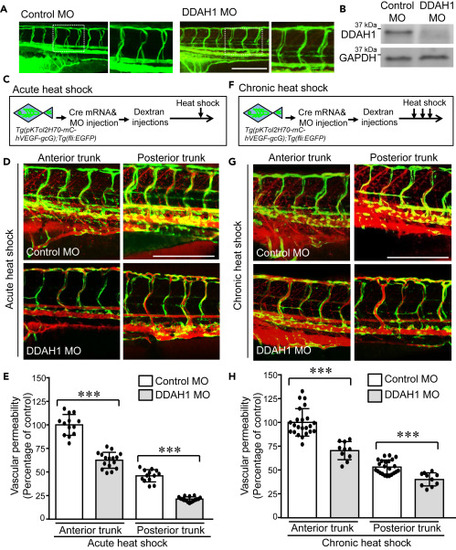
Figure 4. Knockdown of DDAH1 reduces VEGF-mediated acute and chronic vascular hyperpermeability Double transgenic zebrafish Tg(pKTol2H70-mC-hVEGF-gcG);Tg(fli:EGFP) were injected with Cre mRNA and DDAH1 or control morpholino (100 μM, 4.5 nL) at one-cell stage and then microinjected Texas Red-dextran (70 kDa) to the pericardium at 3-dpf. (A) Alignment of ISVs was analyzed. (B) Zebrafish embryos were collected and subjected to western blotting to confirm the decrease of DDAH1 protein levels. (C–F) Control and DDAH MO-injected zebrafish embryos were exposed to a single stimulus of heat shock at 37°C for 30 min (C and D) and three times of incubation at 37°C for 30 min separated by 30-min intervals at 28.5°C (F–G). Zebrafish embryos were imaged (D, G) and the vascular permeability of anterior and posterior trunk regions were quantified with our algorithm and compared (E and H). ∗∗∗, p < 0.001. Zebrafish numbers in each group are presented in the scatter plot. Data is expressed as mean ± SD. Scale bar, 200 μm, in (A, D, and G). |
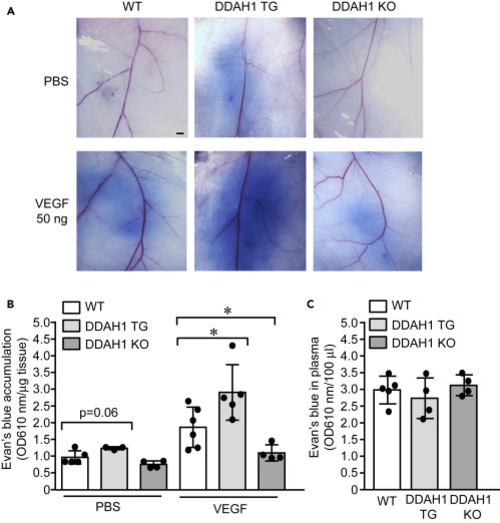
Figure 5. Vascular leakiness was enhanced in DDAH1 transgenic mice but reduced in DDAH1 knockout mice (A–C) Sex- and age-matched wild type (WT), DDAH1 transgenic (TG) and DDAH1 knockout (KO) mice were subjected to Miles assay. Evans blue (1%) were intravenously injected according to body weight and then intradermal injection of VEGF (50 ng) and PBS was performed. Skin was dissected and imaged (A) and Evans blue was quantified after extraction with formamide and normalized to tissue weight (B). Plasma was also collected at the endpoint to show comparable level of Evans blue in the circulation (C). ∗, p<0.05. Animal numbers in each group are presented in the scatter plot. Data is expressed as mean ± SD. Scale bar, 1 mm, in (A) |