
- Title
-
Glucocorticoid-Responsive Transcription Factor Krüppel-Like Factor 9 Regulates fkbp5 and Metabolism
- Authors
- Gans, I.M., Grendler, J., Babich, R., Jayasundara, N., Coffman, J.A.
- Source
- Full text @ Front Cell Dev Biol
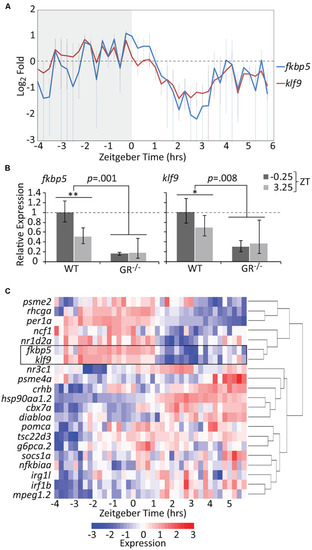
The temporal activities of the GR targets klf9 and fkbp5 are dynamic and synchronous. (A) Average relative levels of klf9 and fkbp5 transcripts in three biological replicates of pooled (n = 3–6) 5 dpf larvae snap-frozen every 15 min from −4 to 6 h zeitgeber time (ZT). Error bars are standard error of the mean of three biological replicates. (B) Relative expression of klf9 and fkbp5 in WT and nr3c1–/– (GR369–, Gans et al., 2020) mutant larvae at −0.25 and +3.25 ZT, time points that, respectively, correspond to the activity peak and nadir of both genes in WT larvae. Error bars represent 95% confidence intervals of three biological replicates of pooled larvae (n = 9 per sample). Significance calculated by two-factor (time and genotype) ANOVA, and one-tailed t-tests to assess the effect of time within each genotype; ∗∗p = 0.01; ∗p = 0.05. (C) Heat map of expression of klf9, fkbp5, and additional targets/regulators of glucocorticoid (GC) signaling as measured on the NanoString platform. Gene panel includes well-known glucocorticoid receptor (GR) targets as well as targets identified by our lab as consistently over-expressed in chronic CORT treated (Gans et al., 2020). Counts data are normalized to reference genes (actb2, rpl13a, and eif5a) and scaled within each gene to normalize for different absolute levels of expression. |
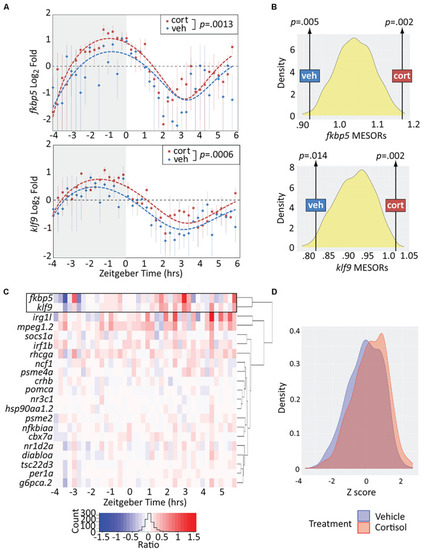
Chronic cortisol treatment similarly upregulates klf9 and fkbp5. (A) Sinusoid models fit to fkbp5 (top) and klf9 (bottom) qPCR relative expression data. Each data point represents the average of three biological replicates of pooled larvae (3–6 larvae per pooled sample; VEH-treated datapoints are the same as in Figure 1). P-values calculated using paired t-test (data paired at each timepoint). Fit of the model to the data was tested by ANOVA (P < 0.0001 in each case, see Supplementary Figure 2). (B) Distributions of Midline Estimated Statistics Of Rhythmicity (MESORs, a rhythm-adjusted mean) of datasets generated by randomly selecting expression data from VEH or CORT samples at each timepoint in experiments shown in panel (A). MESORs of VEH and CORT datasets sit at either extreme. (C) Heat map of the expression ratio in CORT/VEH samples (log2 transformed) of klf9, fkbp5, and other targets of glucocorticoid (GC) signaling in our Nanostring data set. (D) Density plot of Z-scored expression of all genes measured with Nanostring indicates an overall increase in expression due to chronic CORT treatment. |
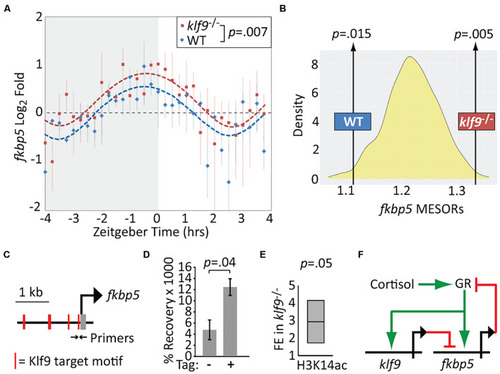
Krüppel-like factor 9 (Klf9) regulates fkbp5. (A) Sinusoid modeling of fkbp5 time-course data obtained by quantitative reverse transcription and polymerase chain reaction (qRT-PCR) of RNA extracted from wildtype (WT) and klf9–/– larvae. Each data point represents the average of three biological replicates of pooled larvae. P-value calculated by paired t-test (data paired at each timepoint). Error bars represent standard error of the mean. Model fits tested by ANOVA (P < 0.0001, see Supplementary Figure 4). (B) Distribution of Midline Estimated Statistics Of Rhythmicity (MESORs) of datasets generated by random sampling as described in Figure 2 and Methods. MESORs of measured WT and klf9–/– data sit at either extreme. (C) Schematic of putative Klf9 target motifs in the fkbp5 promoter region. Black arrows indicate sites of primers used in panels (D,E). (D) Recovery of fkbp5 promoter DNA from WT (-) and Klf9-AM tagged (+) larvae by ChIP with anti-AM tag antibody. (E) Fold enrichment (FE) of fkbp5 promoter DNA recovered in klf9–/– mutants with ChIP using antibody to acetyled-H3K14. (F) Proposed gene regulatory circuit containing the glucocorticoid receptor (GR), fkbp5, and klf9. Activation is denoted by green arrows, repression by red lines. |
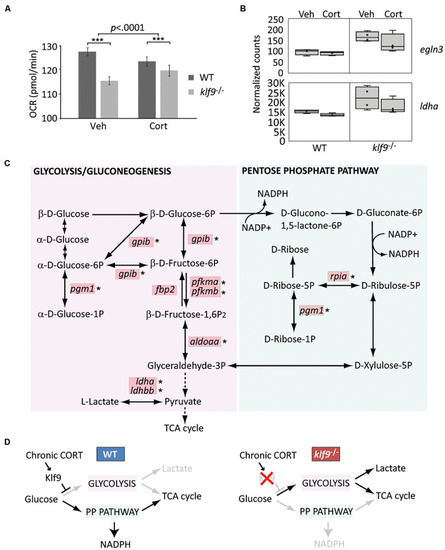
Klf9 regulates metabolism. (A) Oxygen consumption rate (OCR) at 1 dpf, as measured by Seahorse XF96 extracellular flux analyzer. The averages of three experimental replicates are shown, each with 20 embryos per condition measured individually and simultaneously over the course of at least 85 min (thus n = 60 total for each condition). The bars represent the average Y-intercept of linear fits of the averaged time-course data (see Supplementary Figure 12), ±standard error. Two-way ANOVA indicated significant effects of both genotype (WT vs. klf9–/–, p < 0.0001) and treatment (VEH vs. CORT, p = 0.04), as well as a significant interaction (p < 0.0001). ***Adjusted p < 0.0001 by Šídák’s multiple comparisons test. (B) Normalized counts of Hif1a target egln3 and glycolytic gene ldha (from Gans et al., 2020). (C) Krüppel-like factor 9 (Klf9) downregulates multiple genes in the glycolysis/gluconeogenesis pathway. Red boxes indicate genes significantly over expressed (FDR < 0.05) in RNA-seq of klf9–/– larvae compared to wild type (Gans et al., 2020). Asterisks denote genes in which putative Klf9 binding sites were identified using HOMER. (D) Model for Klf9-mediated regulation of metabolic flux. In response to stress, Klf9 is predicted to inhibit glycolysis, shunting flux through the Pentose Phosphate Pathway (PPP). PHENOTYPE:
|