FIGURE SUMMARY
Title

Comprehensive multi-omics integration identifies differentially active enhancers during human brain development with clinical relevance

Authors
Yousefi, S., Deng, R., Lanko, K., Salsench, E.M., Nikoncuk, A., van der Linde, H.C., Perenthaler, E., van Ham, T.J., Mulugeta, E., Barakat, T.S.
Source
Full text @ Genome Med.

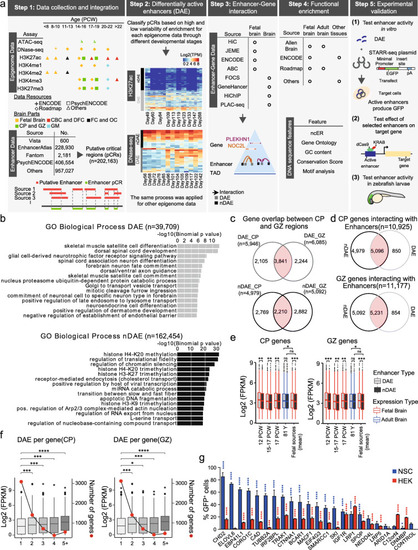
Integrative analysis of brain enhancers during fetal development. A Various steps taken in the integrative analysis of this study. See text for details. B Functional enrichment analysis using GREAT [17], for DAEs (upper panel, n = 39,709) and nDAEs (lower panel, n = 162,454), determined using whole genome as a background. X-axis reports the − Log10 p value as determined by GREAT. C Venn diagram showing the overlap between DAEs (upper panel) and nDAEs (lower panel) interacting with protein-coding and lincRNA genes in CP (left) and GZ (right). D Venn diagram showing the overlap between interactions of protein-coding and lincRNA genes with nDAEs (left) and DAEs (right), for protein-coding and lincRNA genes in CP (upper panel) and GZ (lower panel). E Box plots showing gene expression levels as determined by RNA-seq, for genes that interact by HiC with DAEs (light gray) or nDAEs (dark gray) in CP (left) and GZ (right), for fetal (red) or adult (blue) brain samples. Boxes are interquartile range (IQR); line is median; and whiskers extend to 1.5 the IQR. PCW, postconceptional week. FPKM, fragments per kilobase of transcript per million mapped reads. * p < 0.05; ** p < 0.01; *** p < 0.001; ns, not significant (wilcox.test). Data obtained from: 12 PCW, Yan et al [18]; 15-17 PCW, De la Torre-Ubieta et al [19]; 17 PCW, Roadmap [10]; 81 years, Roadmap [10]; mean of fetal sources is the mean expression of the first three fetal samples. F Box plots showing RNA-seq gene expression for genes interacting with 1, 2, 3, 4, or 5 or more DAEs in CP (left) and GZ (right). Left y-axis shows gene expression (log2 FPKM), right y-axis, and line plot shows the number of genes per DAE group. * p < 0.05; ***p < 0.001; ****p < 0.0001 (wilcox.test). RNA-seq data from Allen human brain atlas [20]. G Bar plot showing the percentage of GFP+ cells in NSCs (blue) and HEK cells (red), from cell transfection experiments with an enhancer reporter plasmid for 22 tested enhancers and an empty plasmid control. Plotted is the percentage of GFP+ in cells co-transfected with an mCherry expressing plasmid, to correct for transfection efficiency. Bars show the average from two independent experiments, with each enhancer tested each in duplicate. Error bars represent standard deviation. * p < 0.05; ** p < 0.01; *** p < 0.001; **** p < 0.0001 (one-way ANOVA test followed by multiple comparison test (Fisher’s LSD test)

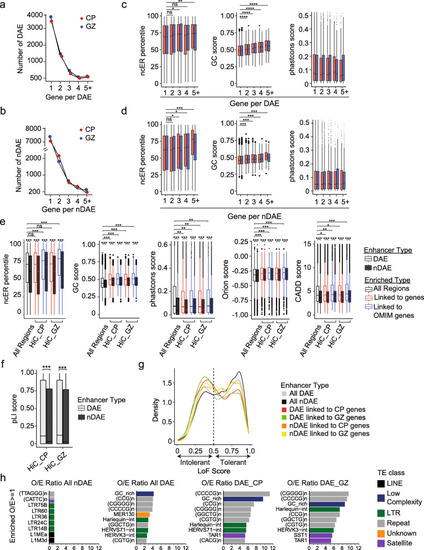
Distinct sequence characteristics between DAEs and nDAEs. A Line graph showing the number of protein-coding and lincRNA genes (1, 2, 3, 4, or 5 or more) that each DAE is interacting with, and the number of DAEs per category, for CP (red) and GZ (blue). B As A, but here for nDAEs. C Box plots showing the median ncER percentile (left) [38], GC content score (middle) [39] or phastcons score (right) [39] for DAEs-CP (red) and DAEs-GZ (blue) that interact with 1, 2, 3, 4, or 5 or more protein-coding and lincRNA genes. Boxes are IQR; line is median; and whiskers extend to 1.5 the IQR. * p < 0.05; ** p < 0.01; *** p < 0.001; **** p < 0.0001; ns, not significant (wilcox.test). D As C, but here for nDAEs. E Box plots, showing from left to right ncER percentile [38], GC content score [39], phastcons score [39], Orion score [40], and CADD score [41], for all DAEs (light gray) and nDAEs (dark gray), or for those DAEs and nDAEs that are interacting in CP or GZ with protein-coding and lincRNA genes (red) or genes with a known OMIM phenotype (blue). Boxes are IQR; line is median; and whiskers extend to 1.5 the IQR. * p < 0.05; ** p < 0.01; *** p < 0.001; ns, not significant (wilcox.test). F Box plot showing the pLI score [42] of genes interacting with DAEs (light gray) and nDAEs (dark gray) in CP or GZ. Boxes are IQR; line is median; and whiskers extend to 1.5 the IQR. *** p < 0.001; (wilcox.test). G Kernel density plot showing the distribution of loss-of-function tolerance scores for non-coding sequences [43] for all DAEs (light gray), all nDAEs (dark gray), DAEs linked to protein-coding and lincRNA genes in CP (red), DAEs linked to protein-coding and lincRNA genes in GZ (green), nDAEs linked to protein-coding and lincRNA genes in CP (orange), and nDAEs linked to protein-coding and lincRNA genes in GZ (yellow). H Bar chart showing the most enriched transposable elements (TEs) overlapping with from left to right all nDAEs, all DAEs, DAEs interacting with protein-coding and lincRNA genes in CP, and DAEs interacting with protein-coding genes in GZ. Plotted is a ratio between the observed (O) number of TEs over the expected (E). Different classes of TE are indicated with different colors as indicated

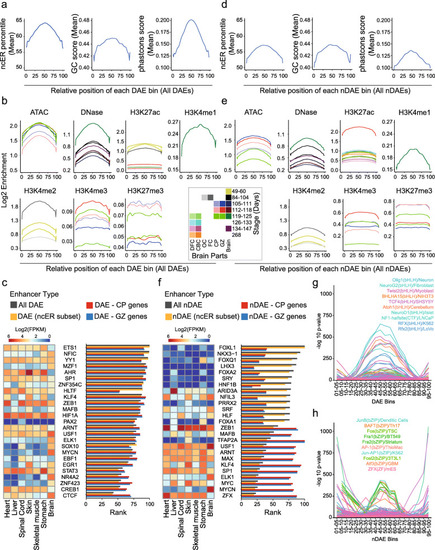
DAEs and nDAEs are enriched for distinct transcription factor binding sites. A Line plot showing the distribution of the mean ncER percentile (left) [38], GC content score (middle) [39], and phastcons score (right) [39] over the relative bin position for all DAEs. B Line plot showing the log2 enrichment for various epigenome features as indicated, over the relative bin positions for all DAEs. Different colors indicate different time points of human brain development and different brain regions from which the data were obtained. DFC, dorsal frontal cortex; CBC, cerebellar cortex; OC, occipital cortex; FC, frontal cortex; CP, cortical plate; GZ, germinal zone; Brain, whole brain. Epigenome data used are summarized in Additional file 3: Table S2. C Bar chart showing the relative LOLA enrichment of TFs from JASPAR in all DAEs (light gray), in the central part of all DAEs (ncER subset, orange), in DAEs linked to genes in CP (red) and in DAEs linked to genes in GZ (blue). X-axis displays the rank score (a combination of p value, odds ratio from Fisher’s exact test, and the raw number of overlapping regions) from LOLA. The rank was re-scaled between 0 and 100, so that DAEs with a larger TFs enrichment have a higher rank. Also shown is a heatmap showing the RNA-seq expression levels (Log2 FPKM) of the same TFs across various human fetal tissues. RNA-seq data obtained from ENCODE project [7]. D As in A, but here for nDAEs. E As in B, but here for nDAEs. Note the difference in y-axis scale for H3K4me3 and H3K27me3 compared to panel B given the higher enrichment in nDAEs. F As in C, but now for nDAEs. G Line plot showing the distribution of enrichment (− log10 p value as determined by HOMER analysis) across the relative DAE bins, for the 251 TF motifs that were not equally enriched in all 20 bin groups. The most enriched TF motifs are indicated. H As G, but now for 218 TFs that were not equally enriched across the 20 bin groups of all nDAEs

Clustering of DAEs unravels temporal dynamics of brain gene regulation. A Heatmap displaying all available epigenome features for PCW 8-12, across all DAEs interacting with protein-coding genes in CP (upper heatmap) and GZ (lower heatmap) (AI). K-means clustering analysis of epigenome features (AII) identifies two clusters, cluster 1 (red) and cluster 2 (green). Level of enrichment is indicated on the y-axis in Log2 TPM. Box plots (AIII) shows RNA-seq gene expression of protein-coding genes regulated by the DAEs from each cluster (Expression pattern), for available data from PCW 8, 9, and 12 [20]. Boxes are IQR; line is median; and whiskers extend to 1.5 the IQR. Gene enrichment analysis for the corresponding genes in each cluster (AIV). X-axis shows the − log 10 (p value) from Enrichr. B As for A, but now for PCW 13–18. C As for A, but now for PCW > 18

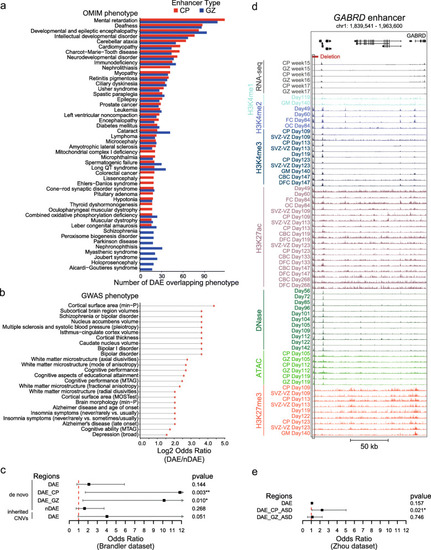
Variants in DAEs and nDAEs are associated with human disease. A Bar graph showing the number of DAEs linked to their target genes in CP and GZ and their most enriched OMIM phenotypes. B Plot showing the top-25 GWAS phenotypes that are enriched in DAEs compared to nDAEs (log2 odds ratio DAE/nDAE). C Line graph showing the odds ratio, confidence interval, and p value for enrichment of CNVs from an ASD cohort at DAEs and nDAEs. CNVs data obtained from Brandler et al [44]. * p < 0.05; ** p < 0.01 (Fisher’s exact test). D Genome browser track showing the regulatory landscape of the GABRD gene. Indicated are a DAE (chr1: 1,840,449-1,840,835) that is interacting with the GABRD promoter, and a deletion (chr1: 1,840,001-1,845,000) that is found in an epilepsy patient (CNET0068) from Monlong et al. [45].* p < 0.05 (Fisher’s exact test). E Line graph showing the odds ratio, confidence interval, and p value for enrichment of SNV from an ASD cohort at DAEs and nDAEs. SNV data obtained from Zhou et al. [46]

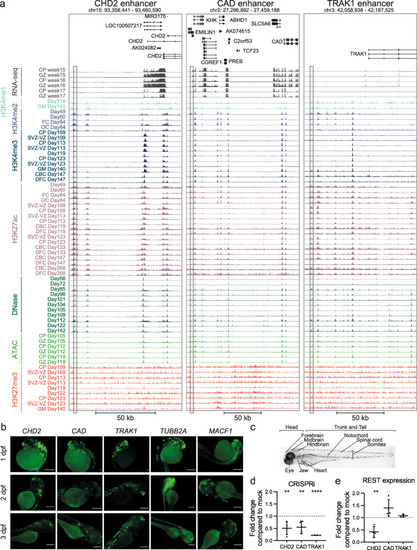
CRISPRi and zebrafish experiments validate activity of DAEs regulating genes involved in neurogenetic disorders. A Genome browser tracks showing enhancers interacting with CHD2 (left), CAD (middle), and TRAK1 (right). Shown are RNA-seq expression profiles, various histone modifications, and ATAC-seq and DNase profiles for various time points during human fetal brain development, as indicated. The tested DAEs are indicated by the box. B Representative fluorescent images showing GFP expression of transgenic enhancer reporter assays in zebrafish larvae at 1, 2, and 3 dpf. Tested are the enhancers for CHD2, CAD, and TRAK1 (shown in A), and two additional enhancers for MACF1 and TUBB2A. The five tested enhancers induced GFP expression in the head of the larvae, amongst others in the forebrain in 61.1%, 81.8%, and 87.9% larvae for CHD2; 88.9%, 85.4%, and 85.7% for CAD; 87.1%, 70%, and 88.5% for TRAK1; 81.5%, 85.7%, and 76.2% for MACF1; and 87.5%, 100%, and 100% for TUBB2A, respectively at 1, 2, and 3 dpf. Also peripheral neuron-specific GFP expression was found, with 0%, 60.6%, and 21.2% for CHD2; 68.9%, 24.4%, and 51.4% for CAD; 83.6%, 65.5%, and 67.3% for TRAK1; 37%, 50%, and 33.3% for MACF1; and 50%, 83.3%, and 63.3% for TUBB2A, respectively at 1, 2, and 3 dpf. See also Additional file 14: Table S13. Scale bars represent 500 μm. C Bright-field image of a wild type zebrafish larvae at 3 dpf (lateral view), with the anatomical sites that were scored for GFP expression indicated. D qRT-PCR showing reduction of CHD2, CAD, and TRAK1 expression in NSCs upon silencing of respective enhancer by dCas9-KRAB-MECP2. Data represent fold change of expression of respective genes compared to mock transfected cells (KRAB-MECP2 plasmid only, no gRNA plasmid). Two independent transfection experiments were performed, each in duplicate. All data points and standard deviation are shown. ** p < 0.01; **** p < 0.0001 (one-way ANOVA test followed by multiple comparison test (Fisher’s LSD test). E qRT-PCR showing reduction of REST expression in NSCs upon silencing of CHD2, CAD, or TRAK1 enhancers by dCas9-KRAB-MECP2. Data represent fold change of REST expression compared to mock transfected cells (KRAB-MECP2 plasmid only, no gRNA plasmid). Two independent transfection experiments were performed, each in duplicate. All data points and standard deviation are shown. ** p < 0.01 (one-way ANOVA test followed by multiple comparison test (Fisher’s LSD test)

Acknowledgments
This image is the copyrighted work of the attributed author or publisher, and ZFIN has permission only to display this image to its users. Additional permissions should be obtained from the applicable author or publisher of the image. Full text @ Genome Med.