Figure Caption
Fig. 6
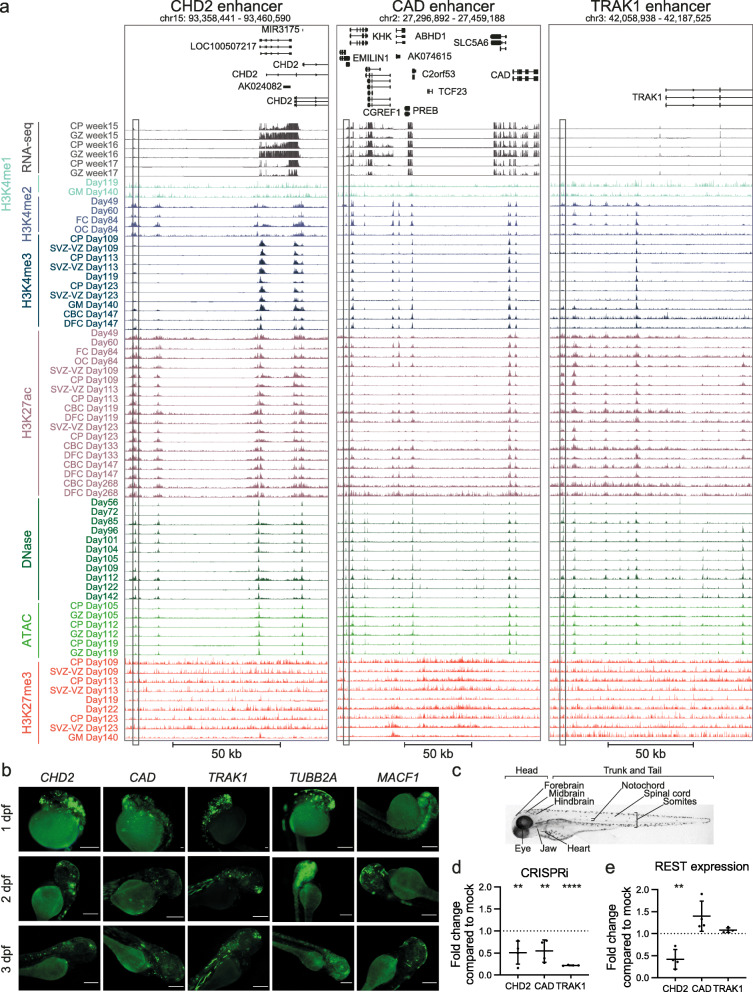
CRISPRi and zebrafish experiments validate activity of DAEs regulating genes involved in neurogenetic disorders. A Genome browser tracks showing enhancers interacting with CHD2 (left), CAD (middle), and TRAK1 (right). Shown are RNA-seq expression profiles, various histone modifications, and ATAC-seq and DNase profiles for various time points during human fetal brain development, as indicated. The tested DAEs are indicated by the box. B Representative fluorescent images showing GFP expression of transgenic enhancer reporter assays in zebrafish larvae at 1, 2, and 3 dpf. Tested are the enhancers for CHD2, CAD, and TRAK1 (shown in A), and two additional enhancers for MACF1 and TUBB2A. The five tested enhancers induced GFP expression in the head of the larvae, amongst others in the forebrain in 61.1%, 81.8%, and 87.9% larvae for CHD2; 88.9%, 85.4%, and 85.7% for CAD; 87.1%, 70%, and 88.5% for TRAK1; 81.5%, 85.7%, and 76.2% for MACF1; and 87.5%, 100%, and 100% for TUBB2A, respectively at 1, 2, and 3 dpf. Also peripheral neuron-specific GFP expression was found, with 0%, 60.6%, and 21.2% for CHD2; 68.9%, 24.4%, and 51.4% for CAD; 83.6%, 65.5%, and 67.3% for TRAK1; 37%, 50%, and 33.3% for MACF1; and 50%, 83.3%, and 63.3% for TUBB2A, respectively at 1, 2, and 3 dpf. See also Additional file 14: Table S13. Scale bars represent 500 μm. C Bright-field image of a wild type zebrafish larvae at 3 dpf (lateral view), with the anatomical sites that were scored for GFP expression indicated. D qRT-PCR showing reduction of CHD2, CAD, and TRAK1 expression in NSCs upon silencing of respective enhancer by dCas9-KRAB-MECP2. Data represent fold change of expression of respective genes compared to mock transfected cells (KRAB-MECP2 plasmid only, no gRNA plasmid). Two independent transfection experiments were performed, each in duplicate. All data points and standard deviation are shown. ** p < 0.01; **** p < 0.0001 (one-way ANOVA test followed by multiple comparison test (Fisher’s LSD test). E qRT-PCR showing reduction of REST expression in NSCs upon silencing of CHD2, CAD, or TRAK1 enhancers by dCas9-KRAB-MECP2. Data represent fold change of REST expression compared to mock transfected cells (KRAB-MECP2 plasmid only, no gRNA plasmid). Two independent transfection experiments were performed, each in duplicate. All data points and standard deviation are shown. ** p < 0.01 (one-way ANOVA test followed by multiple comparison test (Fisher’s LSD test)
Acknowledgments
This image is the copyrighted work of the attributed author or publisher, and
ZFIN has permission only to display this image to its users.
Additional permissions should be obtained from the applicable author or publisher of the image.
Full text @ Genome Med.