FIGURE

Fig. 5

ID
ZDB-FIG-211025-112
Publication
Yousefi et al., 2021 - Comprehensive multi-omics integration identifies differentially active enhancers during human brain development with clinical relevance
Other Figures
All Figure Page
Back to All Figure Page
Fig. 5

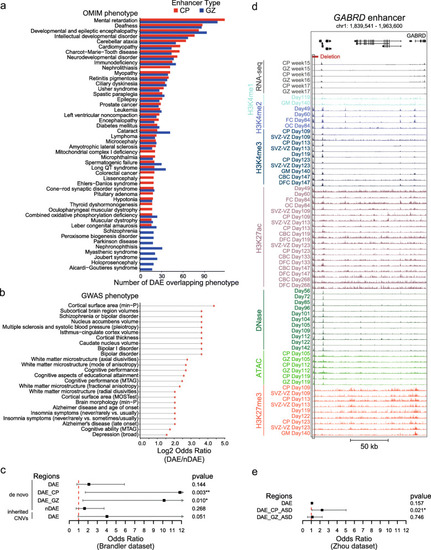
Variants in DAEs and nDAEs are associated with human disease. A Bar graph showing the number of DAEs linked to their target genes in CP and GZ and their most enriched OMIM phenotypes. B Plot showing the top-25 GWAS phenotypes that are enriched in DAEs compared to nDAEs (log2 odds ratio DAE/nDAE). C Line graph showing the odds ratio, confidence interval, and p value for enrichment of CNVs from an ASD cohort at DAEs and nDAEs. CNVs data obtained from Brandler et al [44]. * p < 0.05; ** p < 0.01 (Fisher’s exact test). D Genome browser track showing the regulatory landscape of the GABRD gene. Indicated are a DAE (chr1: 1,840,449-1,840,835) that is interacting with the GABRD promoter, and a deletion (chr1: 1,840,001-1,845,000) that is found in an epilepsy patient (CNET0068) from Monlong et al. [45].* p < 0.05 (Fisher’s exact test). E Line graph showing the odds ratio, confidence interval, and p value for enrichment of SNV from an ASD cohort at DAEs and nDAEs. SNV data obtained from Zhou et al. [46]

Expression Data

Expression Detail
Antibody Labeling
Phenotype Data

Phenotype Detail
Acknowledgments
This image is the copyrighted work of the attributed author or publisher, and ZFIN has permission only to display this image to its users. Additional permissions should be obtained from the applicable author or publisher of the image. Full text @ Genome Med.