
- Title
-
Chip Protein U-Box Domain Truncation Affects Purkinje Neuron Morphology and Leads to Behavioral Changes in Zebrafish
- Authors
- Pakdaman, Y., Denker, E., Austad, E., Norton, W.H.J., Rolfsnes, H.O., Bindoff, L.A., Tzoulis, C., Aukrust, I., Knappskog, P.M., Johansson, S., Ellingsen, S.
- Source
- Full text @ Front. Mol. Neurosci.
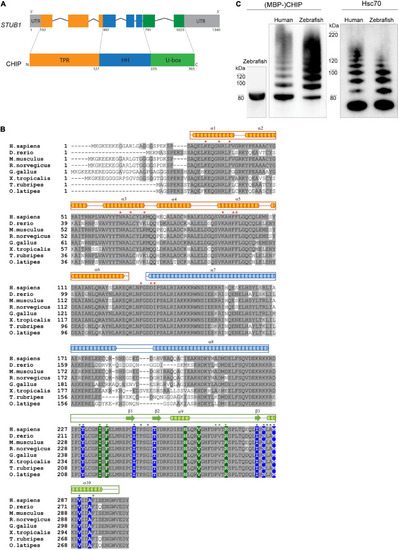
Figure 1. CHIP structure and ubiquitination activity is conserved among human and zebrafish. (A) Seven exons in the structure of STUB1 gene correspond to the TPR, helical hairpin, and U-box domains of CHIP protein. (B) Alignment of CHIP sequence from human (H. sapiens), zebrafish (D. rerio), mouse (M. musculus), rat (R. norvegicus), chicken (G. gallus), frog (X. tropicalis), pufferfish (T. rubripes), and Japanese rice fish (O. latipes). The predicted position of secondary structures is displayed above the corresponding amino acid sequences in orange, blue, and green boxes corresponding to the TPR, helical hairpin, and U-box domains, respectively. Main residues involved in the U-box dimerization (in blue) as well as interactions via the TPR (in orange) and U-box (in green) domains are marked with background color (reported in zebrafish Chip) and/or asterisks (reported in mouse CHIP). This figure was produced by using T-Coffee (Notredame et al., 2000). (C) MBP-Chip recombinant protein was detected by Western blot analysis around 80 kDa (lane 1). Identical Hsc70- and self-ubiquitination activities were observed for human CHIP (lanes 2 and 4) and zebrafish Chip (lanes 3 and 5), shown by multiple ubiquitinated bands above MBP-CHIP (lanes 2 and 3) and Hsc70 (lanes 4 and 5). |
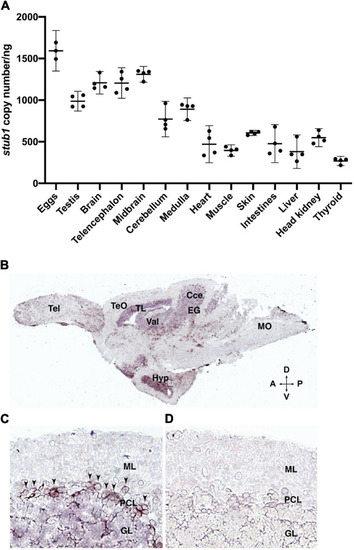
Figure 2. stub1 mRNAs are expressed in different tissues and in the Purkinje cells of adult zebrafish cerebellum. (A) Scatter plot of ddPCR data presenting the absolute number of stub1 transcripts per ng of cDNA for different zebrafish tissues. Each dot represents a biological replicate. Means and standard deviations are indicated by the lines and bars in the graph (n = 4). (B) DIG-labeled stub1 cDNA probes were synthesized, and used for visualization of stub1 mRNA expression in adult zebrafish brain sections, using in situ hybridization assay. (C) Detailed view of cerebellum where stub1 positive cells in the Purkinje cell layer are indicated by arrowheads. (D) Negative control corresponding to the same area as shown in (B). Tel, telencephalon; TeO, tectum opticum; TL, torus longitudinalis; Val, valvula cerebelli; Cce, Corpus cerebelli; EG, eminentia granularis; Mo, medulla oblongata; Hyp, hypothalamus; A, anterior; P, posterior; D, dorsal; V, ventral; ML, molecular layer; PCL, Purkinje cell layer; GL, granular layer. EXPRESSION / LABELING:
|
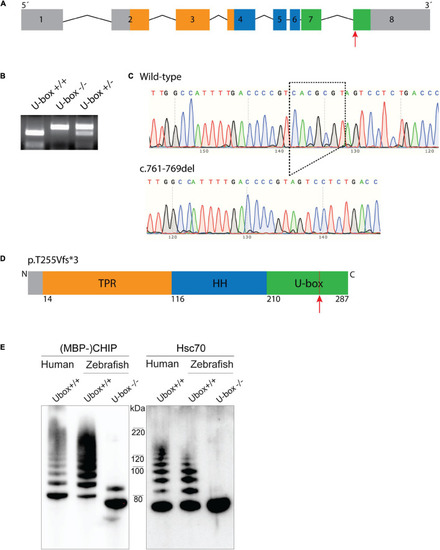
Figure 3. Zebrafish U-box− /− expressing truncated Chip with impaired ubiquitin ligase activity were generated by CRISPR/Cas9. Zebrafish stub1 gene was targeted for mutagenesis at the last exon (A), leading to an introduction of 7 bp-deletion mutation in this exon (c.761-769del) which was detected by MluI restriction digestion (B) and DNA sequencing (C). The 761-769del mutation is predicted to result in a frameshift and early stop codon and truncation of C-terminal U-box domain (D). Recombinant Chip proteins were produced from the cDNA of U-box− /− and wild-type zebrafish, and further examined for in vitro ubiquitin ligase activity on Chip (E, lane 1–3) and Hsc70 substrates (E, lane 4–6). Compared to the wild-type human CHIP (E, lane 1 and 4) and wild-type zebrafish Chip (E, lane 2 and 5) controls, U-box truncated zebrafish Chips showed impaired self-ubiquitination (E, lane 3) and Hsc70 ubiquitination activities (E, lane 6). |
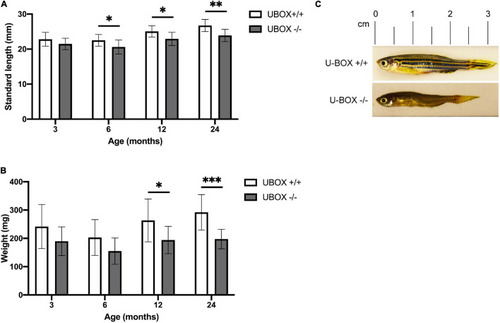
Figure 4. U-box− /− fish are associated with smaller body size compared to their wild-type siblings. Quantification of standard length (A) and body weight (B) are presented for wild-type and U-box− /− zebrafish in indicated age groups (n = 10). Data shown are means and error bars indicate standard deviation. Statistically significant differences are shown by asterisks (∗p < 0.05; ∗∗p < 0.01; ∗∗∗p < 0.001, Student’s t-test). (C) Representative images of U-box− /− and wild-type zebrafish (female) at 24 months of age. PHENOTYPE:
|
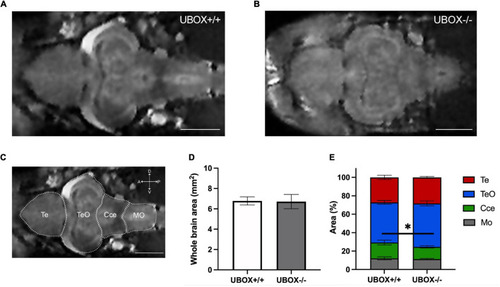
Figure 5. Magnetic resonance imaging of wild-type and U-box− /− zebrafish brains demonstrate similar intact structures. MRI of the adult zebrafish brain at 24 months revealed no significant alterations in the overall brain structures between wild-type (A) and mutant (B) zebrafish. (C) Different regions of a wild-type zebrafish brain are indicated on a representative MRI image. Section area of the whole brain (D,E) the relative area of different regions (D) were calculated by using Fiji (ImageJ) software (31). Data shown are means and error bars indicate standard deviations (∗p < 0.05, Student’s t-test). Scale bars in (A–C): 1 mm. Te, telencephalon; TeO, tectum opticum; Cce, corpus cerebelli; Mo, medulla oblongata. PHENOTYPE:
|
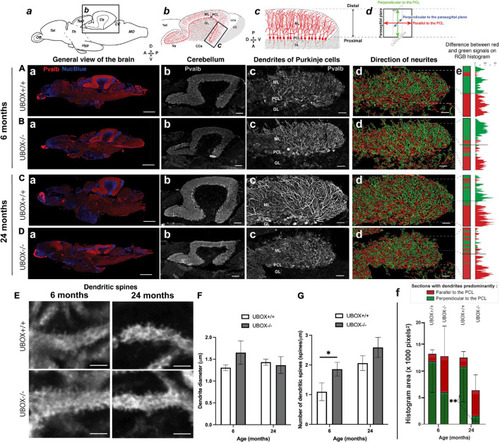
Figure 6. U-box− /− mutants present a progressive dendrite arbor disorganization and an initial increase in dendritic spines. (A–E) Fluorescent immunohistochemistry on 8 μm sagittal cryosections of wild-type (A,C, and top E) and mutant (B,D, and bottom E) fish using Parvalbumin as a marker for Purkinje cells. The diagrams on top of (a–d) columns show the localization, orientation and structure of the underlying pictures. (A–Da) are slide scanner acquisitions showing the general anatomy of the brain, and (A–Db) are close-ups of the cerebellum from the same pictures. (A–Dc) are maximum z-projections of confocal stacks centered on the molecular layer of the posterior cerebellum, and (A–Dd) are the 3D renderings of neuronal tracing analysis on the stacks presented in c. The adjacent color bars on the right (e) highlight trends in the dendrite orientation along the proximal-distal axis of the molecular layer, each quantified as the histogram area for the distal part of the molecular layer and indicated time points (f). (E) pictures are single confocal sections presenting a zoomed view of dendritic spines in the median to distal areas of the molecular layer. (F,G) present quantification results of the dendrite diameter (F) and the number of dendritic spines (G) at the two time-points as means ± standard deviations (∗p < 0.05 and ∗∗p < 0.01, Student’s t-test). Scale bars in (A–D): 400 μm in a, 100 μm in b and 30 μm in (c–d). Scale bars in (E): 2,5 μm. |
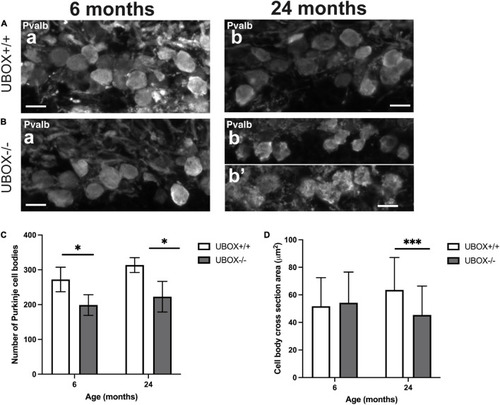
Figure 7. The number and size of Purkinje cell bodies are progressively reduced in U-box− /− fish. Fluorescent immunohistochemistry on 8 μm sagittal cryosections on wild-type (A) and mutant (B) at 6 (a) and 24 (b,b’) months fish using Parvalbumin as a marker for Purkinje cells. (C,D) present quantification results for the average number of Purkinje cell bodies (C) and average cell body cross-section area (D) at the two time-points as means ± standard deviations. Statistically significant differences are shown by asterisks (∗p < 0.05 and ∗∗∗p < 0.001 Student’s t-test). Scale bars in (A,B): 10 μm. |
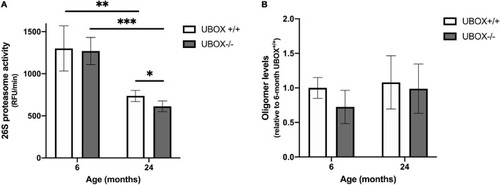
Figure 8. Reduced 26S proteasome activity was detected in U-box− /− fish. (A) Chymotrypsin-like activity was measured in brain tissues of U-box− /− and wild-type fish at 6 and 24 months (n = 4). Statistically significant differences are shown by asterisks (∗p < 0.05; ∗∗p < 0.01; ∗∗∗p < 0.001, Student’s t-test). (B) Oligomer expression quantified from dot blot analysis in brain tissues of U-box− /− and wild-type fish at 6 and 24 months (n = 3). Data shown are means and error bars indicate standard deviations. |
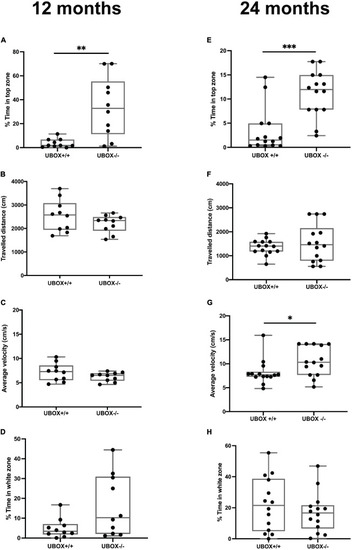
Figure 9. U-box− /− fish exhibit less anxiety-like behavior compared to the wild-type fish. The anxiety-like behavior of wild-type and U-box− /− fish was measured by novel tank diving and light/dark preference tests. In the novel tank diving test, the fraction of time spent in the top third zone of the novel tank (A,E), the distance traveled (B,F), and average velocity (C,G) was quantified and compared for each genotype group (n = 10–14 per group) at 12 (A–C) and 24 months (E–G). In the light/dark preference test, the fraction of time spent in the white zone of the tank was quantified and compared for each group (n = 10–14 per group) at 12 (D) and 24 (H) months. Data shown are the lower and upper quartiles (Q1–Q3) and the whiskers show range of values outside Q1-Q3. Statistically significant differences are shown by asterisks (∗p < 0.05; ∗∗p < 0.01; ∗∗∗p < 0.001, Student’s t-test). PHENOTYPE:
|