
|
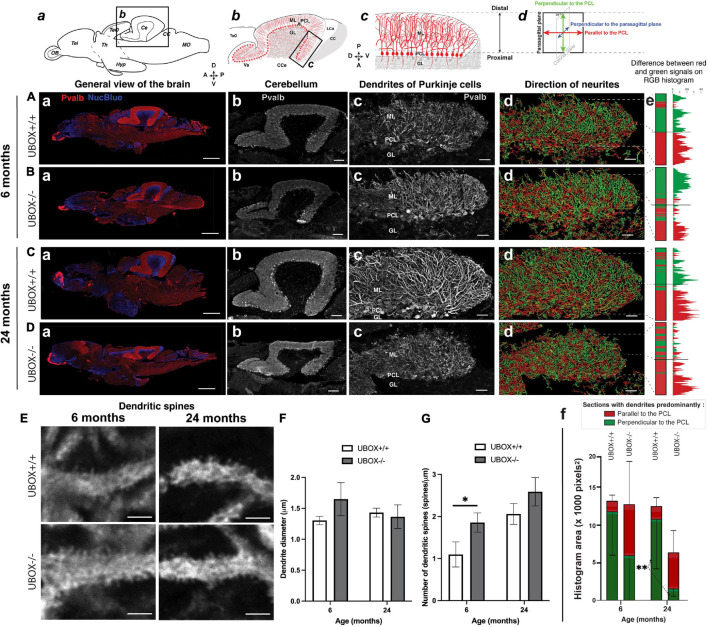
FIGURE 6
Figure 6. U-box− /− mutants present a progressive dendrite arbor disorganization and an initial increase in dendritic spines. (A–E) Fluorescent immunohistochemistry on 8 μm sagittal cryosections of wild-type (A,C, and top E) and mutant (B,D, and bottom E) fish using Parvalbumin as a marker for Purkinje cells. The diagrams on top of (a–d) columns show the localization, orientation and structure of the underlying pictures. (A–Da) are slide scanner acquisitions showing the general anatomy of the brain, and (A–Db) are close-ups of the cerebellum from the same pictures. (A–Dc) are maximum z-projections of confocal stacks centered on the molecular layer of the posterior cerebellum, and (A–Dd) are the 3D renderings of neuronal tracing analysis on the stacks presented in c. The adjacent color bars on the right (e) highlight trends in the dendrite orientation along the proximal-distal axis of the molecular layer, each quantified as the histogram area for the distal part of the molecular layer and indicated time points (f). (E) pictures are single confocal sections presenting a zoomed view of dendritic spines in the median to distal areas of the molecular layer. (F,G) present quantification results of the dendrite diameter (F) and the number of dendritic spines (G) at the two time-points as means ± standard deviations (∗p < 0.05 and ∗∗p < 0.01, Student’s t-test). Scale bars in (A–D): 400 μm in a, 100 μm in b and 30 μm in (c–d). Scale bars in (E): 2,5 μm.