
- Title
-
DNA template strand segregation in developing zebrafish
- Authors
- Glasauer, S.M.K., Triemer, T., Neef, A.B., Neuhauss, S.C.F., Luedtke, N.W.
- Source
- Full text @ Cell Chem Biol
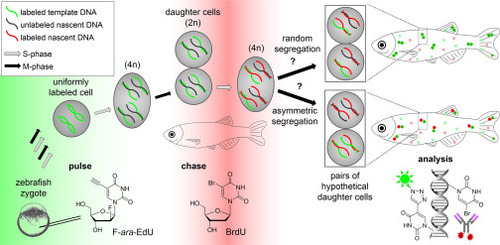
Figure 1. Approach to the study of template strand segregation in zebrafish F-ara-EdU (green) is injected into the zebrafish zygote as a “pulse” to label embryonic DNA. BrdU (red) is introduced through incubation before the end of a variable chase period. At least two divisions during the chase are required to distinguish between symmetrical and asymmetrical events of stem cell segregation. Fish are fixed and stained for F-ara-EdU and BrdU using an Alexa Fluor azide dye and an anti-BrdU antibody, respectively. |
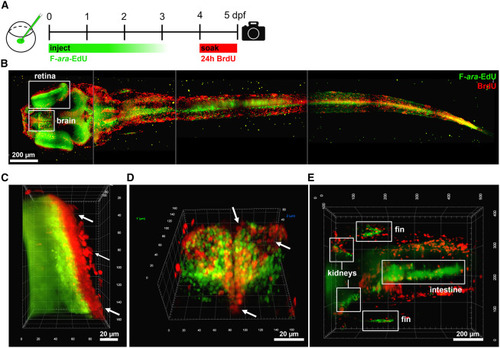
Figure 2. Whole-mount analysis of label retaining and proliferating body regions using light sheet microscopy (A) Experimental approach where zygotes were injected with 5.7 pmol F-ara-EdU, followed by soaking in 10 mM BrdU from 4-5 dpf, fixation and staining. Maximum intensity light sheet projections of a whole zebrafish: (B) dorsal view of whole animal composed of four merged images, (C) anterior view of eye, (D) anterior view of forebrain, and (E) dorsal view of the mid-body region. See Supplemental Video 1 showing 3-D representation. Arrows indicate examples of BrdU positive / Fara-EdU negative cells. |
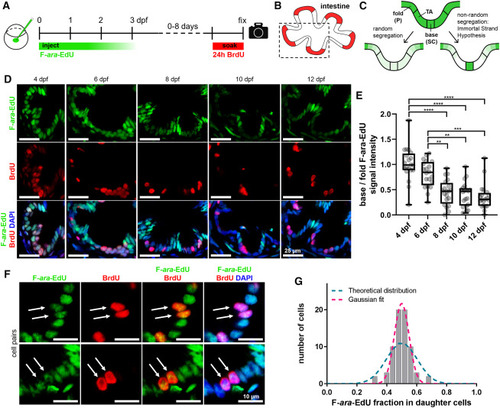
Figure 3. Template strand segregation in the intestine (A) Zygotes were injected with 5.7 pmol F-ara-EdU; 10 mM BrdU was administered through incubation for 24 h before the end of the variable chase period. (B) Scheme of the intestine highlighting the proliferative zone at the base of intestinal folds in red. (C) Models of F-ara-EdU pulse dilution in two hypothetical scenarios: random template strand segregation and nonrandom template strand segregation according to the immortal strand hypothesis. (D) Observed F-ara-EdU label depletion and colocalization with BrdU. (E) Quantification of F-ara EdU signal decay in base vs. fold cells (see STAR Methods). Statistical significance was determined using the Kruskal-Wallis test with post hoc multiple comparisons. n = 100 base/fold structures, 19 fish total (20 base/fold structures and 3–4 fish per time point). Box and whiskers plot represents median (line in box center), first and third quartile (lower and upper box border, respectively), and minimum and maximum values (whiskers), as well as individual data points (spheres). (F) Examples of F-ara-EdU/BrdU double-positive cell pairs (arrows). (G) F-ara-EdU intensity ratios in daughter cells (n = 35 pairs, see STAR Methods). A binomial curve centered at 0.5 (magenta) was fitted to the data (R2 = 0.99). The blue curve represents the theoretical, normal (Gaussian) distribution for random segregation. Quantification was performed using raw images (see STAR Methods), whereas images shown in in (D) and (F) were adjusted in brightness and contrast for better visualization. P, postmitotic cells; SC, stem cells; TA, transit-amplifying cells. ∗∗p ≤ 0.01, ∗∗∗p ≤ 0.001, ∗∗∗∗p ≤ 0.0001. |
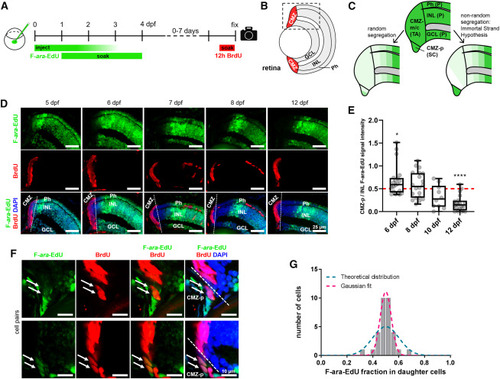
Figure 4. Template strand segregation in the CMZ of the retina (A) Zygotes were injected with 5.7 pmol F-ara-EdU, followed by incubation in 1 mM F-ara-EdU from 1 to 4 dpf; 10 mM BrdU was administered for 12 h before the end of the chase through incubation. (B) Schematics of the retina highlighting the ciliary marginal zone in red. (C) Models of F-ara-EdU pulse dilution in two hypothetical scenarios: random template strand segregation and nonrandom template strand segregation according to the immortal strand hypothesis. (D) Observed F-ara-EdU label depletion from the CMZ over time. (E) Quantification of F-ara EdU signal decay in CMZ-p (stem cells) vs. INL (postmitotic) cells (see STAR Methods). Statistical significance was determined using the one-sample Wilcoxon test and a hypothetical value of 0.5. n = 70 CMZ-p cells from eight fish total (10–20 cells and two fish per time point). Box and whiskers plot represents median (line in box center), first and third quartile (lower and upper box border, respectively), and minimum and maximum values (whiskers), as well as individual data points (spheres). (F) Examples of F-ara-EdU/BrdU double-positive cell pairs (arrows). (G) F-ara-EdU intensity ratios in daughter cells (n = 21 pairs, see STAR Methods). A binomial curve centered at 0.5 (magenta) was fitted to the data (R2 = 0.98). The blue curve represents the theoretical, normal (Gaussian) distribution for random segregation. Quantification was performed on raw images (see STAR Methods), whereas images shown in (D) and (F) were adjusted in brightness and contrast for better visualization. CMZ, ciliary marginal zone; CMZ-m/c, middle and central peripheral ciliary marginal zone; CMZ-p, peripheral ciliary marginal zone; GCL, ganglion cell layer; INL, inner nuclear layer; P, postmitotic cells; Ph, photoreceptor layer; SC, stem cells; TA, transit-amplifying cells. ∗p ≤ 0.05, ∗∗∗∗p ≤ 0.0001. |
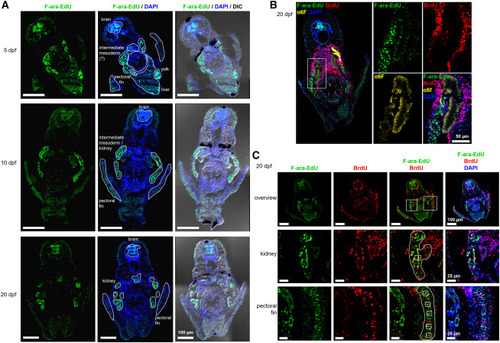
Figure 5. Label-retaining cells in the zebrafish mid-body region (A) Zygotes were microinjected with 5.7 pmol F-ara-EdU, and fish were grown to 5, 10, or 20 dpf. Fixed and sectioned zebrafish were stained with Alexa Fluor 488 azide and total DNA was counterstained using DAPI. (B) Same treatment as in (A), but sections were additionally stained with the kidney marker alpha6F. (C) Same treatment as in (A), but fish were additionally incubated in 10 mM BrdU for 24 h prior to fixation. Sister cell pairs are marked by white boxes in the increased magnification images (middle and bottom row). Transverse sections through the mid-body region are shown. |
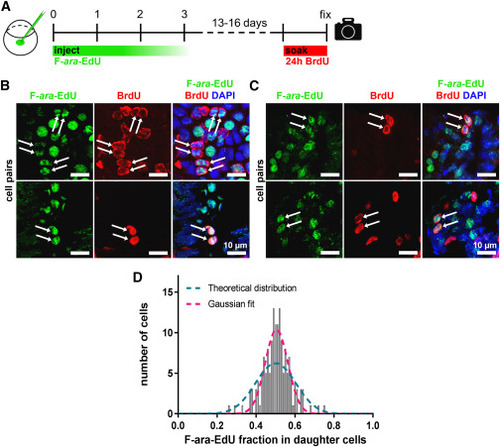
Figure 6. Template strand segregation in pectoral fins and kidneys (A) Zygotes were injected with 5.7 pmol F-ara-EdU as pulse; 10 mM BrdU was administered through incubation for 24 h before the end of the chase at 17–21 dpf. (B and C) Representative maximum intensity projections of Huygens-deconvolved F-ara-EdU/BrdU double-positive cell pairs (arrows) in pectoral fins (B) and kidneys (C). Partial BrdU staining, apparent as peripheral nuclear staining, was observed in some cell types, but this did not interfere with the identification of daughter cell pairs or F-ara-EdU quantification. (D) F-ara-EdU intensity ratios between daughter cells (n = 80 cell pairs). A binomial curve centered at 0.5 (magenta) was fitted to the data (R2 = 0.89). The blue curve represents the theoretical, normal (Gaussian) distribution for random segregation. Quantification was performed on raw images (see STAR Methods), whereas images shown in (B) and (C) were adjusted in brightness and contrast for better visualization. |