
- Title
-
A zebrafish screen reveals Renin-angiotensin system inhibitors as neuroprotective via mitochondrial restoration in dopamine neurons
- Authors
- Kim, G.J., Mo, H., Liu, H., Wu, Z., Chen, S., Zheng, J., Zhao, X., Nucum, D., Shortland, J., Peng, L., Elepano, M., Tang, B., Olson, S., Paras, N., Li, H., Renslo, A.R., Arkin, M.R., Huang, B., Lu, B., Sirota, M., Guo, S.
- Source
- Full text @ Elife
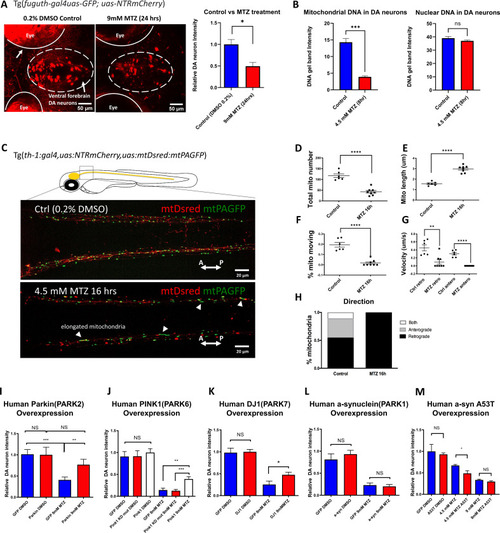
(A) Confocal images of ventral forebrain DA neurons in 0.2% DMSO control and 9 mM MTZ-treated 6 days post fertilization (dpf) transgenic larval zebrafish brains show significant difference in normalized fluorescent intensity (n = 10; p < 0.05, unpaired t test). The red fluorescence in the eyes is due to pigment-derived autofluorescence. (B) Long-range PCR of mitochondrial DNA versus nuclear DNA products using ventral forebrain DA neurons from control and MTZ-treated 6 dpf larval zebrafish brains anterior to the mid-hindbrain boundary (4.5 mM, 8 hrs) (n = 4 pools of 25 larval brains per pool; p < 0.01, unpaired t test). (C) Live confocal imaging of mitochondrial dynamics with mitochondria-targeted DsRed and mitochondria-targeted photoactivatable GFP in 5dpf larvae treated with 0.2% DMSO (control) or 4.5 mM MTZ for 16 hr. Arrowheads point to the elongated appearance of mitochondria in DA axons of MTZ-treated animals. (D–H) Analysis of mitochondrial dynamics including total mitochondrial count, length, % moving, velocity, and direction of movement between control and MTZ-treated samples (n = 8–10; **p < 0.01, ****p < 0.0001, unpaired t test). (I–M) Overexpression of PD-associated human genes including PARK2, PARK6, PARK7, PARK1, and associated mutant forms. mRNAs were microinjected into one-cell stage transgenic embryos and treated with 4.5 or 9 mM MTZ at 30hpf for 24 hrs to determine the neuroprotective effect of experimental conditions compared to control GFP-encoding mRNA injection (n = 10–12; *p < 0.05, **p < 0.01, ***p < 0.001, unpaired t test).
|

(A) A flow chart outlining the screening pipeline. 5dpf transgenic larvae expressing Tg[fuguth:gal4-uas:GFP;uas:NTRmCherry] were arranged in glass bottom 96-well plates and treated with MTZ (4.5 mM, 48 hrs) along with each of the 1403 bioactive compounds (n = 3 per screening compound). The dual flashlight plot of Brain Health Score (BHS) and Strictly Standardized Mean Difference (SSMD) score was used to quantify the neuroprotective effects of all compounds in the screen. (B) Wilcoxon rank sum test was performed to compare data of all 1403 compounds with those representing RAAS inhibitors (n = 13) in the screened compound set, revealing a significantly higher SSMD score distribution in the RAAS inhibitor group (p = 0.012, Wilcoxon rank sum test). (C) Secondary hit validation. To obtain more precise data, before and after treatment imaging was carried out for each larva embedded in agarose and a treatment regimen with 9 mM MTZ for 24 hr was used. Compounds including the RAAS inhibitors and the N-acetyl cysteine (NAC) control compound were tested at 10 µM with increased sample size (n = 40 per group; *p < 0.05, **p < 0.01, ***p < 0.001, unpaired t test). (D) Confocal images of ventral forebrain DA neurons. Positive control (0.2 % DMSO), negative control (9 mM MTZ), and 9 mM MTZ +10 µM olmesartan following 24 hrs of treatment. (E) Schematic of the chronic drug treatment and behavior test for adult zebrafish. (F) Quantification of total distance traveled across 5 min recording in the home tank for adult zebrafish treated with 0.2 % DMSO (positive control), 5 mM MTZ (negative control), 5 mM MTZ +10 mM levodopa, and 5 mM MTZ +10 µM olmesartan (with daily change of drug solutions after behavioral recording). Distance recordings were conducted for baseline, 3, 6, 9, 12, and 14 days. ANOVA and post-hoc Tukey test showed significant difference in 12 and 14 days for the MTZ versus MTZ+ olmesartan-treated groups. [n = 6 (three males, three females) for MTZ and MTZ+ Olm, n = 4 (two males, two females) for DMSO control and levodopa; p < 0.01, one-way ANOVA post-hoc Tukey’s test]. (G) Mass spectrometry data of adult zebrafish homogenized brain versus body samples after 14 days of chronic treatment with Olmesartan (n = 6, three males and three females). (H) Quantification of relative fluorescent intensity of DA neurons at 6 dpf in positive control (0.2% DMSO), negative control (9 mM MTZ, 24 hr from 5 dpf to 6 dpf), agtr1a morphant +9 mM MTZ, agtr1b morphant +9 mM MTZ, agtr1a/agtr1b double morphant +9 mM MTZ, and 10 µM olmesartan +9 mM MTZ (n = 10–12; *p < 0.05, ***p < 0.001, unpaired t test).
|
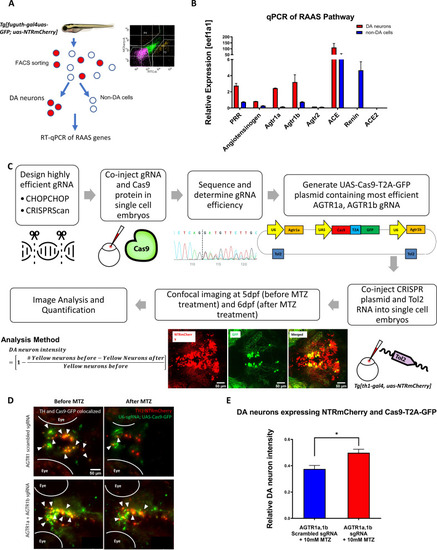
(A) Schematic showing the procedure of FACs to isolate DA neurons for qPCR analysis of RAAS pathway gene expression. (B) qPCR data of 5 dpf larval samples show the relative expression of RAAS pathway genes normalized to the house-keeping gene eef1a1, in DA neurons (red bars) versus non-DA cells (blue bars). PRR (prorenin receptor), agtr1a (Angiotensin II receptor, type 1a), agtr1b (Angiotensin II receptor, type 1b), agtr2 (Angiotensin II receptor, type 2), ace (Angiotensin I converting enzyme), ace2 (Angiotensin I converting enzyme 2) (n = 2 biological replicates, 6 technical replicates). (C) A schematic showing the conditional CRISPR design, imaging, and analysis procedure to inactivate agtr1a and agtr1b in DA neurons. (D) Confocal images of DA neurons in 5 dpf (before MTZ treatment) and 6 dpf (24 hr after 10 mM MTZ treatment) larvae injected with either the scrambled control sgRNA construct (top) or the effective agtr1a and agtr1b sgRNA construct (bottom). Yellow cells express both NTR-mCherry and Cas9. (E) Quantification shows a significant preservation of DA neuron intensity in the agtr1a and agtr1b sgRNA construct-injected animals compared to the scrambled sgRNA control upon 10 mM MTZ treatment. (n = 15, p < 0.01, unpaired t-test).
|
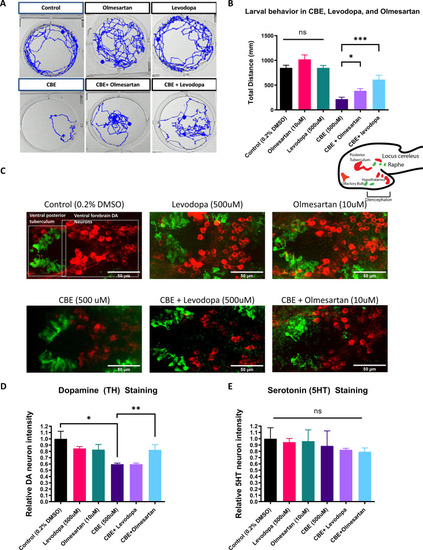
(A) Locomotor tracks of 5 dpf larvae treated 24 hr with 0.2 % DMSO, 500 µM CBE, 10 µM olmesartan, and 500 µM levodopa. The background subtraction method was used to identify and track movement for 5 min duration. (B) Quantification of total distance (in millimeters, mm) travelled during 5 min recordings for each sample group. Drugs were added at the indicated concentrations and incubated for 24 hr before behavioral recording (n = 12–13; *p < 0.05, ***p < 0.001, unpaired t test) (C) Confocal images of TH-immunoreactive DA neurons (red) and 5HT-immunoreactive serotonin neurons (green) in 6dpf larval zebrafish brains after treatments as indicated in (B). (D–E) Quantification of neurons in the demarcated regions as shown in (C). Fluorescent intensity was quantified using ImageJ and normalized against the control (0.2% DMSO) (n = 8; *p < 0.05, **p < 0.01, unpaired t test).
|

(A) A schematic showing the RNA-seq procedure of larval samples from chemical treatment to FACs, library preparation, and differential gene expression analysis. (B) A heatmap of clustering analysis comparing the differential gene expression in DMSO control, olmesartan, CBE, MTZ, MTZ+ olmesartan, and CBE+ olmesartan treatment groups. Gene counts were normalized and analyzed with the R program DESeq2 package. All samples are numbered 1, 2, and 3 to indicate biological replicates. (C–D) Venn diagrams showing the overlapping gene expression alterations between different conditions: MTZ/control and CBE/control (C) and MTZ+ Olmesartan/MTZ and CBE+ Olmesartan/CBE (D) (α = 0.05, FDR = 0.1, Wald test). (E–F) Metascape ontology clusters highlighting the top enriched GO terms for differential gene expression common between that of MTZ/Control and CBE/Control (E) and that of MTZ+ olmesartan/MTZ and CBE+ olmesartan/CBE (F). The colors of the nodes correspond to significant values. The size of the nodes is proportional to the number of input genes in the GO term. The most significant GO terms in both (E) and (F) include oxidative phosphorylation, respiratory electron transport, ATP metabolic process, and inorganic cation transport.
|
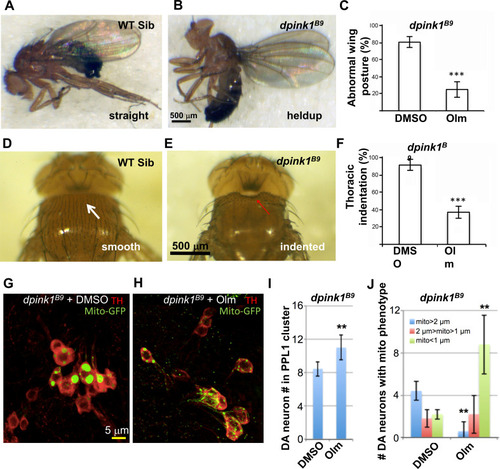
(A–F) images show the abnormal wing posture (B) and thoracic indentation (E) in the mutant compared to wild-type siblings (A,D). Quantification of %mutant individuals with abnormal wing posture (C) and thoracic indentation (F) showed a significant difference between vehicle- and drug (olmesartan)-treated samples. (G–J) Effect of olmesartan on the mitochondrial aggregation and DA neuron loss phenotypes of pink1 mutant, in comparison to DMSO control. Mitochondria are labeled with mito-GFP reporter. Data quantification shown in I, J. (n = 12; **, p < 0.01, *** p < 0.001, unpaired t-test).
|

(A) Flow chart showing the patient cohort studied in the PPMI data. Red circles indicate groups of patients on RAAS, not on RAAS, and on other anti-hypertension medications (HTN) used for the time to levodopa analysis. Green circles indicate the patient cohorts not on levodopa for 3+ years that were used for the UPDRS Part 1, 2, and 3 analyses. (B) Average time to levodopa therapy for de novo PD patients shows significant difference in patients taking RAAS inhibitors versus patients not on RAAS inhibitors (n = 96 and 212; p < 0.05, unpaired t-test) (C) Kaplan Meier survival curve showing the percentage of HTN patients free of levodopa over time for those on RAAS inhibitors versus on other anti-hypertensive medications. HTN patients on RAAS inhibitors showed greater percentage free of levodopa over time compared to patients on other HTN medications (n = 96 and 42; p < 0.05, Log-rank Mantel-cox test). (D) UPDRS Score part one shows significantly worsened (higher) scores for subsequent visits in the No RAAS group and the group using other anti-hypertensives compared to the group on RAAS inhibitors (n = 46, 24, and 103; p = 0.023, one-way ANOVA, post-hoc Tukey).
|