
|
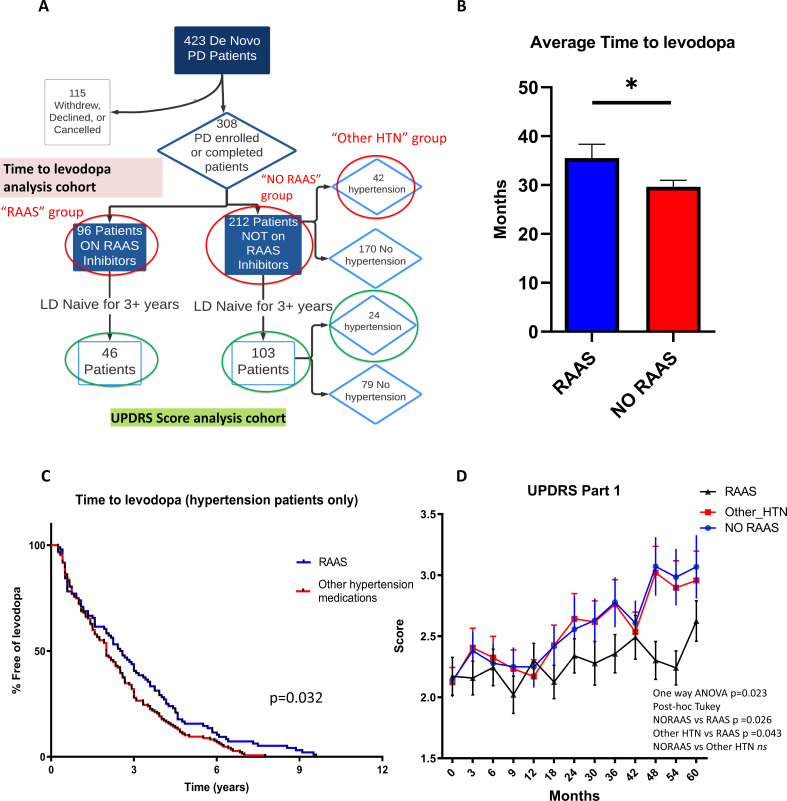
Figure 7
(A) Flow chart showing the patient cohort studied in the PPMI data. Red circles indicate groups of patients on RAAS, not on RAAS, and on other anti-hypertension medications (HTN) used for the time to levodopa analysis. Green circles indicate the patient cohorts not on levodopa for 3+ years that were used for the UPDRS Part 1, 2, and 3 analyses. (B) Average time to levodopa therapy for de novo PD patients shows significant difference in patients taking RAAS inhibitors versus patients not on RAAS inhibitors (n = 96 and 212; p < 0.05, unpaired t-test) (C) Kaplan Meier survival curve showing the percentage of HTN patients free of levodopa over time for those on RAAS inhibitors versus on other anti-hypertensive medications. HTN patients on RAAS inhibitors showed greater percentage free of levodopa over time compared to patients on other HTN medications (n = 96 and 42; p < 0.05, Log-rank Mantel-cox test). (D) UPDRS Score part one shows significantly worsened (higher) scores for subsequent visits in the No RAAS group and the group using other anti-hypertensives compared to the group on RAAS inhibitors (n = 46, 24, and 103; p = 0.023, one-way ANOVA, post-hoc Tukey).
Clinical data analysis uncovers delayed disease progression in PD patients on RAAS inhibitors.