
- Title
-
Preliminary Insight of Pyrrolylated-Chalcones as New Anti-Methicillin-Resistant Staphylococcus aureus (Anti-MRSA) Agents
- Authors
- Gunasekharan, M., Choi, T.I., Rukayadi, Y., Mohammad Latif, M.A., Karunakaran, T., Mohd Faudzi, S.M., Kim, C.H.
- Source
- Full text @ Molecules
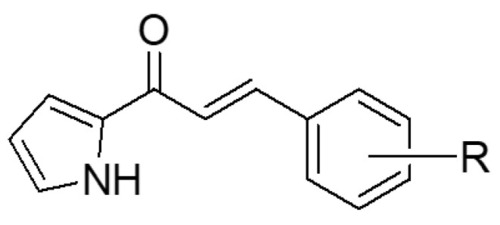
Molecular structure of chalcone (1,3-diaryl-2-propenone). |
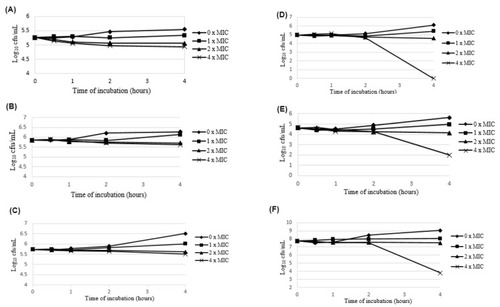
Time-kill curve of MRSA ATCC 700699 after exposure to (A) compound 8 and (B) compound 9 at 0× MIC (0 mg/mL), 1× MIC (0.156 mg/mL), 2× MIC (0.313 mg/mL), and 4× MIC (0.625 mg/mL), as well as (C) compound 10 at 0× MIC (0 mg/mL), 1× MIC (0.313 mg/mL), 2× MIC (0.625 mg/mL), and 4× MIC (1.25 mg/mL). Time-kill curve of clinical MRSA 172918 after exposure to (D) compound 8 at 0× MIC (0 mg/mL), 1× MIC (0.078 mg/mL), 2× MIC (0.156 mg/mL), and 4× MIC (0.312 mg/mL), (E) compound 9 at 0× MIC (0 mg/mL), 1× MIC (0.156 mg/mL), 2× MIC (0.313 mg/mL), and 4× MIC (0.625 mg/mL), and (F) compound 10 at 0× MIC (0 mg/mL), 1× MIC (0.313 mg/mL), 2× MIC (0.625 mg/mL), and 4× MIC (1.25 mg/mL). |
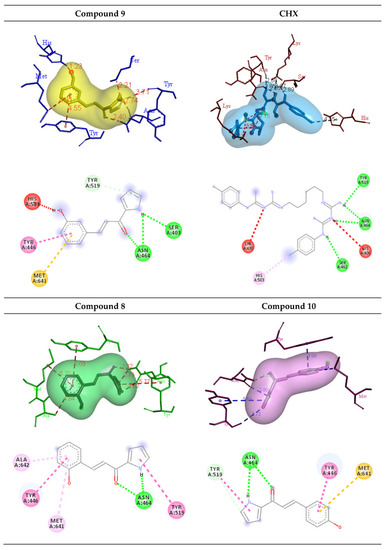
3D and 2D diagrams of the binding interaction of hydroxylated compounds 8, 9, and 10 (green line: H bond; light green line; carbon H bond/π-donor H bond; red line: donor-donor; yellow line: π-sulphur; pink line: π-π stacked/π-π T-shaped; light pink line: π-alkyl) and CHX (green line: H bond; red line: positive-positive; light purple line: π -alkyl) with the amino acid residues on the active site of the PBP2a receptor. |
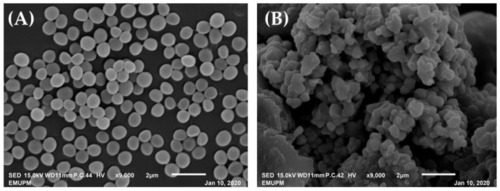
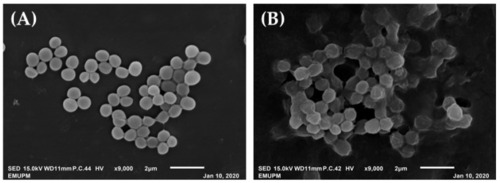
Scanning electron micrograph of (A) untreated and (B) treated with 1% of compound 9 on the standard MRSA ATCC 700699 cells for two hours. |
Scanning electron micrograph of (A) untreated and (B) treated with 1% of compound 9 on the clinical MRSA 172918 cells for two hours. |
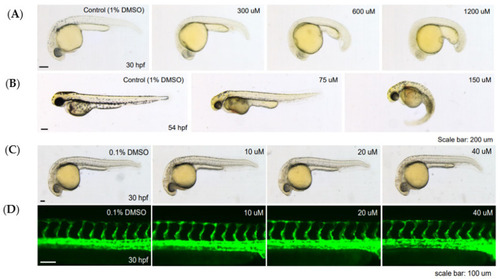
Morphological features of zebrafish embryos at different developmental stages. (A) At 30 hpf after a 24-h exposure to analogue 9 at concentrations of 300, 600, and 1200 µM, (B) at 54 hpf after a 48-h exposure to analogue 9 at concentrations of 75 and 150 µM, as well as (C) at 30 hpf after a 24-h exposure to analogue 9 at concentrations of 10, 20, and 40 µM. (D) Effects of analogue 9 at concentrations 10, 20, and 40 µM on blood vessel development in transgenic zebrafish, Tg(kdrl:egfp) at 30 hpf, same embryos as in (C). Vasculogenesis and angiogenesis in the trunk region were normal in both the control and analogue 9-treated zebrafish. |
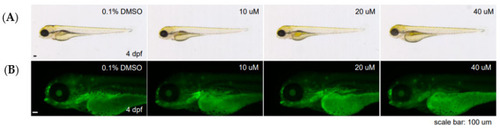
(A) Effects of compound 9 on later stage zebrafish larvae (4 dpf) at their respective concentrations of 10, 20, and 40 μM. (B) Detection of apoptosis or cell death via acridine orange, fluorescent vital dye staining. Non-specific signals in yolk and eye lens are autofluorescence shown in both the control and compound 9-treated animals. |