
- Title
-
Molecular basis for bipartite recognition of histone H3 by the PZP domain of PHF14
- Authors
- Zheng, S., Bi, Y., Chen, H., Gong, B., Jia, S., Li, H.
- Source
- Full text @ Nucleic Acids Res.

PHF14PZP is an unmodified histone H3(1–34) reader. (A) Schematic diagram showing the domain architecture of human PHF14. (B) PZP motif based-evolutionary analyses of PHF14 homologs using the Neighbor-Joining method. The evolutionary distances were computed using the Poisson correction method and are drawn to scale in the diagram. The numbers next to each node were given as percentages and represent bootstrap support for the node (500 replicates). Evolutionary analysis was conducted in MEGA7 (37–40). (C–E) ITC fitting curves of zebrafish PHF14PZP (C), BRPF1PZP (D) and AF10PZP (E) titrated with histone H3 peptides in different frames. N.D. = not detected. |

Crystal structure of PHF14PZP in a peptide-free state. (A) Wall-eye stereo view of the overall structure of free PHF14PZP. PHD1 (cyan), ZnK (light blue), PHD2 (light pink), and α-helix (white) are shown as ribbons. Zinc ions are depicted as spheres. Red dotted lines indicate the invisible insertion loop. Key secondary structural elements are labeled. (B) Structural alignment of PHF14PZP (magenta), AF10PZP (green) and BRPF1PZP (white). (C) Interactions between the C-terminal α-helix with PHD1 (left) and PHD2 (right). Key residues are shown as sticks. Hydrogen bonds are shown as green dashes with distances labeled in Å. (D) Structural alignment of PHF14PHD1 (cyan) and PHF14PHD2 (light pink). Note that the insertion loop is topologically equivalent to the β-hairpin tower. |

Molecular details for H3(1–9) readout by PHF14PZP. (A) 2Fo−Fc omit map (blue meshes) around the H3 peptide (yellow sticks) is contoured at the 0.7σ level. PHD1 finger is shown as cyan ribbon. (B) Overall structure of the H3(1–25)-PHF14PZP complex. PHD1 finger (cyan), ZnK (light blue), PHD2 finger (light pink), and H3 peptide (yellow) are shown as ribbons. Zinc ions are depicted as white spheres. (C) Electrostatic surface view of PHF14PZP bound to H3 peptides. Electrostatic potential is shown as a spectrum ranging from − 5 kT/e (red) to + 5 kT/e (blue). (D) Topology diagram of the H3(1–9)-PHF14PZP complex. Helices and strands are labelled and rainbow-colored from the N- (blue) to C- (red) termini. H3 is depicted in yellow and the insertion loop is highlighted in magenta. (E) Binding details of PHF14PZP with H3 peptide. The PHD1 finger of PHF14PZP is shown as a cyan and magenta (loop) ribbon. The residues of H3 peptide are depicted as yellow sticks. Key residues of PHF14PZP are depicted as purple or cyan sticks. Green dashes and red dashes represent the hydrogen bonds and ionic bonds, respectively. (F) ITC fitting curves of PHF14PZP mutants titrated with the H3(1–15) peptide. N.D. = not detected. (G) ITC fitting curves of PHF14PZP titrated with the H3(1–15) peptide bearing different modifications. N.D. = not detected. |

A novel recognition model for H3 peptide readout by PHF14PZP. (A) A summary of different recognition modes of PHD fingers. PHD fingers and their ligands are depicted by cyan and yellow ribbons, respectively. Zinc ions are shown as white spheres and the corresponding secondary structure are labelled. (B) Structural alignment of H3 (yellow)-PHF14 (pale cyan), H3 (light pink)-BHC80 (blue white) and H3 (cyan)-BPTF (white) complexes in wall-eye stereo view. H3 R2, K4, and R8 are depicted as sticks. (C) Sequence alignment of different PHD finger proteins: BHC80 (2PUY), PYGO (2VP7), ING2 (2G6Q), BPTF (2F6J), UHRF1 (3SOX), TAF (5WXG), MLL4PHD6 (6O7G), AIRE (2KFT), MOZ (5B78), BRPF1 (6U04), TRIM24 (3O37), AF10 (5DAH), ORC1b (5HH7). |

Molecular basis for H3(14–34) recognition by PHF14PZP and HDX-MS analyses of H3(1–34) recognition by PHF14PZP. (A) Overall structure of H3(1–13)-PHF14PZP. PHF14PZP is shown as a light blue ribbon. Histone H3 peptide is shown as yellow sticks. Zinc ions are depicted as white spheres. Blue meshes, 2Fo−Fc omit map of histone H3 peptide contoured at 0.7 σ level. (B) ITC fitting curves of H3(1–13)-PHF14PZP and PHF14PZP titrated with H3.1/3(14–34) peptides. (C) Thermodynamic parameters of PHF14PZP and H3(1–13)-PHF14PZP titrated with H3.3(14–34) peptides. (D) Mapping H3(1–34) binding regions on PHF14PZP based on the HDX-MS data. (E) Structure of PHF14PZP is shown in surface view with the corresponding H3(1–34) binding regions color coded as light pink, blue, yellow, and green corresponding to panel (D). Histone H3-Nter and H3-middle are displayed in cyan ribbon and dashes, respectively. (F) The structural alignment of H3-AF10PZP and H3-PHF14PZP complexes. PHF14PZP and AF10PZP are shown as grey and cyan ribbons, respectively. H3 peptides are show as lime (H3-PHF14) and yellow (H3-AF10) ribbons, respectively. The corresponding key elements forming the ‘αZP’ groove are marked. (G) Sequence alignment of PHF14PZP and AF10PZP. Magenta stars represent the key residues for H3(20–28) recognition in AF10PZP. |

Molecular basis for H3(14–34) recognition by PHF14PZP. (A) Structural alignment of PHF14PZP (magenta), H3(1–13)-PHF14PZP (pale cyan), H3(1–25)-PHF14PZP (light pink) and H3-AF10PZP (yellow-grey). Close-up views are a comparison of a ‘closed’ (i) and an ‘open’ (ii) conformation of the ZP linker. Key residues of ZP linker and H3 are shown as sticks and labelled as indicated. The red cross denotes a clash between F383 and a lysine residue of H3; hydrophobic residues are also shown as dotted spheres in cyan. (B) The interaction of insertion loop between ZP-linker region. Key residues are shown as sticks (left). ITC fitting curves of indicated H3(1–13)-PHF14PZP wild type, mutants and PHF14PZP, titrated with H3.3(14–34) peptides (right). P14 is short for PHF14PZP. (C) ITC fitting curves of indicated H3(1–13)-PHF14PZP mutants, PHF14PZP-Δloop and PHF14-I386M V378M titrated with H3.3(14–34) or H3.3(1–34) peptides. P14 is short for PHF14PZP. (D) Co-immunoprecipitation results from HEK293T cells with 3×Flag-PHF14-WT, 3×Flag-PHF14-ΔPZP, 3×Flag-PHF14-Δloop, and 3× Flag-PHF14-I386M overexpression showing bipartite recognition of the H3 tail by PHF14PZP. |
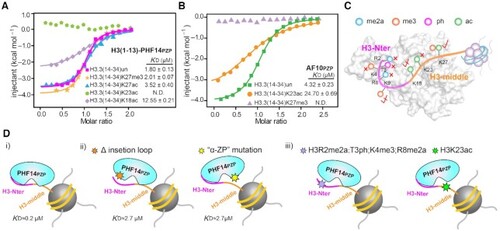
Modification crosstalk and hierarchical switch of H3-PHF14PZP engagement. (A,B) ITC fitting curves of H3(1–13)-PHF14PZP (A) and AF10PZP (B) titrated with H3(14–34) peptides with indicated modifications. N.D. = not detected. (C) A model illustrating modification switch features of H3(1–34)-PHF14PZP engagement. H3-Nter and H3-middle are colored magenta and orange, respectively. Indicated modifications are shown as color-coded spheres. Strictly sensitive, mildly sensitive, and tolerated modifications are denoted by red cross, half-tick, and tick signs, respectively. (D) A model highlighting hierarchical modification switch features for downregulation of the H3(1–34)-PHF14PZP complex formation. H3-Nter and H3-middle are colored magenta and orange, respectively. Hexagonal stars of different colors indicate protein mutations at insertion loop region, mutation at ‘α-ZP’ surface, histone modifications in H3-Nter, and histone modification in H3-middle region, respectively. |