
- Title
-
Efficient Neuroprotective Rescue of Sacsin-Related Disease Phenotypes in Zebrafish
- Authors
- Naef, V., Marchese, M., Ogi, A., Fichi, G., Galatolo, D., Licitra, R., Doccini, S., Verri, T., Argenton, F., Morani, F., Santorelli, F.M.
- Source
- Full text @ Int. J. Mol. Sci.
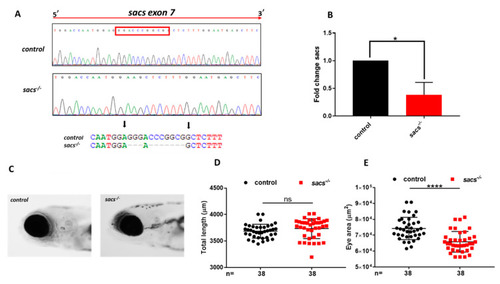
Generation of sacs-null mutant zebrafish. (A) Sequencing chromatographs of control and sacs-null mutant (sacs−/−)specimens and alleles. The red rectangle define frameshift mutation in exon 7. The arrow indicates the area of the induced deletion. (B) qRT-PCR analysis revealed a decrease in the level of sacs mRNA expression, normalized to β-actin. Three independent RNA samples from sacs−/− mutant larvae at 120 hpf and from controls were analyzed. * p ≤ 0.05, calculated by Student’s t-test. (C) Lateral view photographs of representative control and sacs−/− specimens. (D) No dysmorphology and full length was noted at 120 hpf, but (E) homozygous larvae showed slight but significant “microphthalmia”, **** p ≤ 0.00001, calculated by Mann-Whitney test. The values are expressed as mean ± standard deviation (SD). Abbreviations: n, total number of evaluated embryos; error bars indicate standard errors of the means; ns, not significant. |

sacs−/− mutant zebrafish display motor impairment and reduced cerebellar area. (A) Coiling frequency in zebrafish embryos at 30 hpf is decreased in sacs−/− compared with control specimens (sacs−/− n = 113; controls n = 113, in 4 independent experiments). (B) Automated analysis of spontaneous motor activity revealed a reduction in swim distance and velocity in sacs−/− larvae at 120 hpf compared with observations in control siblings (sacs−/− n = 256; controls n = 273, in 5 independent experiments). Statistical analysis (* p ≤ 0.05, *** p ≤ 0.001, **** p ≤ 0.0001) was performed using the Mann-Whitney test. (C) “Cerebellar” morphology as assessed in vivo by RFP fluorescence in Tg(tagRFP-T:PC:GCaMP5G). The “cerebellar” area was found to be significantly reduced in sacs−/− compared with control specimens at 120 hpf. (D) Statistical analysis of the data shown in (C), **** p ≤ 0.00001, calculated by the Mann-Whitney test. The values are expressed as mean ± standard deviation. (E) Dorsal views at 120 hpf of whole-mount larvae labeled with mAB pvalb7 (sacs−/− n = 20; controls n = 20). (F) Pearson’s coefficient of skewness of the distribution of the fluorescence fluctuations, ∆F/F0. These statistics are cumulated from 16 recordings in controls and sacs−/− mutants, respectively. (* p ≤ 0.05 was calculated using the Mann-Whitney test). Abbreviations: n, number of evaluated embryos in total; error bars indicate standard errors of the means. |
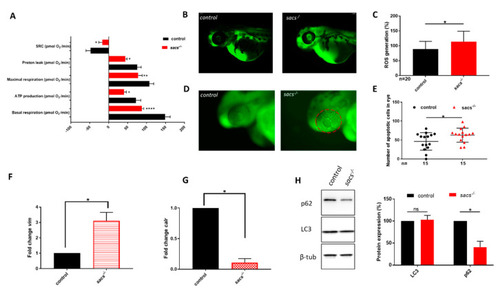
Sacs−/− mutant zebrafish manifest mitochondrial and autophagic dysfunction and ROS accumulation. (A) Mitochondrial respiratory analysis of controls (n = 30) and sacs−/− mutant larvae (n = 37) at 120 hpf. * p ≤ 0.05, ** p ≤ 0.01, **** p ≤ 0.0001, calculated by the Mann-Whitney test. (B) Representative fluorescence images of ROS generation in zebrafish larvae at 48 hpf. (C) Quantitative analysis of ROS generation. * p ≤ 0.05 was calculated by the Mann-Whitney test. The values are expressed as mean ± standard deviation (SD). (D) Detection of apoptotic cells by acridine orange staining at the level of the eye in controls and sacs−/− mutant embryos at 48 hpf (lateral views). Apoptotic cells were counted in the area defined by the red circle. (E) Quantitative analysis of apoptotic cells. * p ≤ 0.05 was calculated by the Mann-Whitney test. The values are expressed as mean ± standard deviation (SD). (F,G) qRT-PCR analysis revealed increases in vim and calr expression, once the mRNA expression levels had been normalized to β-actin. Three independent RNA samples from controls and sacs−/− mutant larvae at 120 hpf were analyzed. * p ≤ 0.05, calculated by Student’s t-test. (H) Three independent larval homogenates from controls (n = 50) and sacs−/− larvae (n = 50) were tested by Western blotting for the expression of p62 and LC3 proteins. The levels of the different proteins were normalized to β-tubulin. * p ≤ 0.05 was calculated by Student’s t-test. Abbreviations: n, number of evaluated embryos in total; error bars indicate standard error of the mean; ns, not significant; SRC, spare respiratory capacity; ROS, reactive oxygen species. |
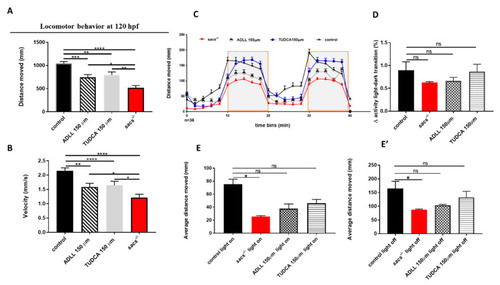
Treatment of homozygous sacs−/− mutants with TUDCA and ADLL is able to rescue the locomotor impairment seen in sacs−/− larvae. (A,B) Automated analysis of spontaneous motor activity of sacs−/− after drug treatments (untreated sacs−/− n = 100; sacs−/− mutants treated with ADLL/Tanganil™ n = 150; sacs−/− mutants treated with TUDCA n = 150; controls n = 167) in 4 independent experiments. * p ≤ 0.05, ** p ≤ 0.01, *** p ≤ 0.001, **** p ≤ 0.0001were calculated by the Mann-Whitney test. (C) Swimming pattern of sacs−/− after drug treatments (untreated sacs−/− n = 34; sacs−/− mutants treated with ADLL/Tanganil™ n = 34; sacs−/− mutants treated with TUDCA n = 34; controls n = 34). Each point in the graph represents the mean ± standard error of the mean of the distance moved by zebrafish larvae in 2-min time bins. The shaded parts represent the dark and the unshaded parts the light periods. The total number of embryos used for each group tested was 36. (D) Between-group differences in the average total activity were evaluated by comparing 1 min after and 1 min before light-to-dark and dark-to-light transitions. Values are represented as means ± standard error of the means. (E,E’) The average of the total activity of each group was measured during light on (E) and light off (E’) conditions. * p ≤ 0.05, calculated by Dunnett’s multiple comparisons test. Abbreviations: n, number of evaluated embryos in total; ns, not significant. PHENOTYPE:
|
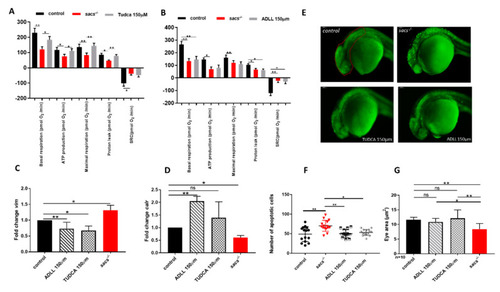
ADLL and TUDCA restore gene expression profile and prevent apoptosis in sacs−/− larvae. (A,B) Mitochondrial respiratory analysis after drug treatments. For each experiment, we compared treated sacs−/− larvae (n = 18) and untreated sacs−/− larvae (n = 18) and control (n = 18) at 120 hpf. * p ≤ 0.05, ** p ≤ 0.01, calculated by the non-parametric Kruskal-Wallis test. (C,D) qRT-PCR analysis on sacs−/− larvae after drug treatments. Three independent RNA samples from each group (controls, untreated sacs−/− and treated sacs−/−) were evaluated. * p ≤ 0.05, ** p ≤ 0.01, calculated by Dunnett’s multiple comparisons test. Abbreviation: ns, not significant (E) Detection of dying cells by acridine orange staining of 24 hpf sacs−/− embryos after drug treatments. The total number of embryos used per group tested (controls, untreated sacs−/− and treated sacs−/−) was 15. (F) Apoptotic cells were counted in the area defined by the red circle. Quantitative analysis of apoptotic cells. * p ≤ 0.05; ** p ≤ 0.01, calculated by the non-parametric Kruskal-Wallis test. The values are expressed as mean ± standard deviation. (G) Evaluation of the eye area of sacs−/− after drug treatments (controls, untreated sacs−/− and treated sacs−/−). * p ≤ 0.05, ** p ≤ 0.01, calculated by the non-parametric Kruskal-Wallis test. The values are expressed as mean ± standard deviation. Abbreviations: n, total number of evaluated embryos; error bars indicate standard errors of the means; ns, not significant. |