
|
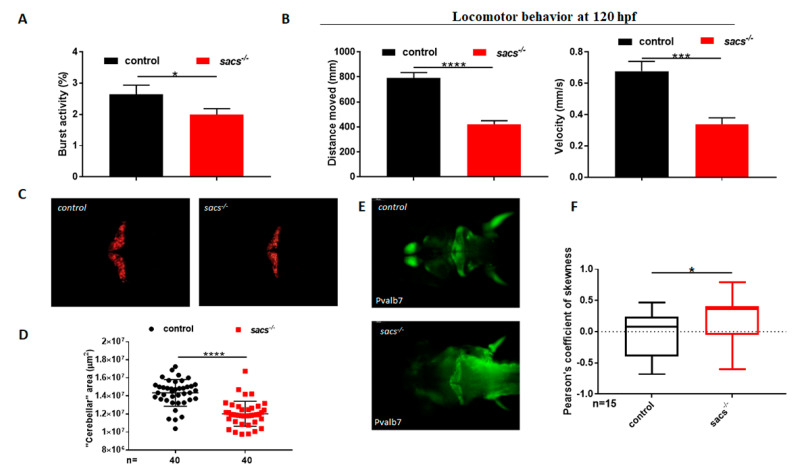
Figure 2
sacs−/− mutant zebrafish display motor impairment and reduced cerebellar area. (A) Coiling frequency in zebrafish embryos at 30 hpf is decreased in sacs−/− compared with control specimens (sacs−/− n = 113; controls n = 113, in 4 independent experiments). (B) Automated analysis of spontaneous motor activity revealed a reduction in swim distance and velocity in sacs−/− larvae at 120 hpf compared with observations in control siblings (sacs−/− n = 256; controls n = 273, in 5 independent experiments). Statistical analysis (* p ≤ 0.05, *** p ≤ 0.001, **** p ≤ 0.0001) was performed using the Mann-Whitney test. (C) “Cerebellar” morphology as assessed in vivo by RFP fluorescence in Tg(tagRFP-T:PC:GCaMP5G). The “cerebellar” area was found to be significantly reduced in sacs−/− compared with control specimens at 120 hpf. (D) Statistical analysis of the data shown in (C), **** p ≤ 0.00001, calculated by the Mann-Whitney test. The values are expressed as mean ± standard deviation. (E) Dorsal views at 120 hpf of whole-mount larvae labeled with mAB pvalb7 (sacs−/− n = 20; controls n = 20). (F) Pearson’s coefficient of skewness of the distribution of the fluorescence fluctuations, ∆F/F0. These statistics are cumulated from 16 recordings in controls and sacs−/− mutants, respectively. (* p ≤ 0.05 was calculated using the Mann-Whitney test). Abbreviations: n, number of evaluated embryos in total; error bars indicate standard errors of the means.