
- Title
-
Gran1: A Granulysin-Derived Peptide with Potent Activity against Intracellular Mycobacterium tuberculosis
- Authors
- Noschka, R., Wondany, F., Kizilsavas, G., Weil, T., Weidinger, G., Walther, P., Michaelis, J., Stenger, S.
- Source
- Full text @ Int. J. Mol. Sci.

Structure and properties of Gran1: (A) Primary sequence and secondary structural elements of Granulysin. The cytolytic active site (amino acids 23–51) of Granulysin was synthesized and named “Gran1”. (B) Physicochemical properties of Gran1 were predicted using the Antimicrobial Peptide Databank server APD3 [18] for the molecular weight, amino acid composition, hydrophobic ratio, and Boman index. (C) Circular dichroism spectra of synthetic Gran1. The CD spectra were measured at decreasing pH by circular dichroism (n = 3). (D) Three-dimensional structure of Gran1 was measured. by 1H-based nuclear magnetic resonance and calculated with Ambiguous Restraints for Iterative Assignment (ARIA). The Left panel shows the 10 best fitting states for the Gran1 structure. The right panel represents the best fitting state of all ten measurements with the phi and psi angles closest in agreement with the Ramachandran plot. |
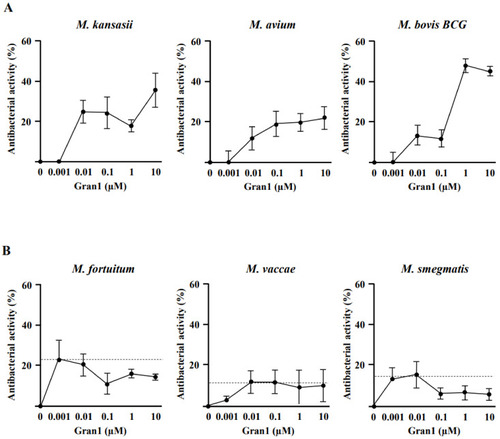
Activity of Gran1 against extracellular mycobacteria: Extracellular mycobacteria (2 × 10⁶) were incubated with increasing concentrations of Gran1 followed by incubation with 3H-Uracil for 18 h. The 3H-Uracil uptake was measured by scintillation counting. Antibacterial activity was determined for (A) slow-growing strains M. kansasii (n = 4), M. avium (n = 5), M. bovis BCG (n = 5) and (B) fast-growing strains M. fortuitum (n = 4), M. vaccae (n = 5), and M. smegmatis (n = 5). Data points show the mean antibacterial activity (%) ± SEM calculated from triplicates of each independent experiment. Dotted horizontal lines indicate background activity of diluent control. |

Colocalization of Gran1 with Mtb and cell wall distortion: (A) Extracellular Mtb (2 × 10⁶) were incubated for 72 h with increasing concentrations of Gran1. Afterwards 3H-Uracil was added for 18 h, and uptake was measured by scintillation counting. Data points show the mean antibacterial activity (%) ± SEM calculated from triplicates of twenty independent experiments. Dotted horizontal lines indicate background activity of diluent control. (B) Extracellular Mtb were labelled with NHS-Atto647N and left un-treated (left panel) or were incubated with Gran1 for 30 min (middle and right panel). For signal overlay of mycobacteria and the peptide, Gran1 was labelled using an anti-Gran1 antibody and an Atto594-conjugated secondary antibody (right panel). Samples were acquired by STED microscopy. The middle panel shows Gran-1 treated, NHS-Atto647N-labelled Mtb, and the right panel shows an overlay of NHS-Atto647N and Atto594-labelled Gran1. Representative images of minimum ten examined Mtb per experiment are shown (n = 2). (C) Extracellular Mtb were treated with Gran1 or left untreated for 3 d and processed for scanning electron microscopy. Representative images show untreated Mtb and Gran1-treated Mtb. Images were acquired using a Hitachi S-5200 scanning electron microscope. Magnification 40.000× to 50.000×. |
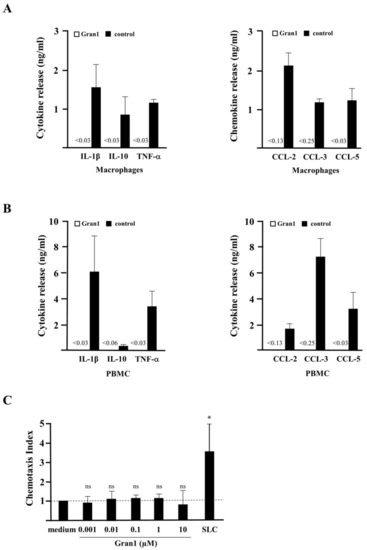
Cytokine release, chemotaxis, and toxicity of Gran1: (A,B) 0.5 × 10⁶ macrophages or PBMC were incubated overnight with Gran1 or positive controls (LPS, 100 ng/mL or PHA, 20 µg/mL, for CCL-5) and the release of the cytokines (left panels) or chemokines (right panels) was determined after overnight incubation with enzyme-linked immunosorbent assay (ELISA). Background of CCL-2 and CCL-3 signals in unstimulated samples were deducted. The small numbers left from the black bars indicate the sensitivity of each ELISA in ng/mL. Bars represent the mean cytokine release + SEM (n = 7). (C) PBMC were incubated for 3 h in a chemotaxis chamber in the presence of Gran1 or SLC (5 µg/mL). The chemotaxis index was calculated by comparison with the number of migrated cells in stimulate samples to the number of migrated cells in un-stimulated samples. Bars represent the mean chemotaxis index + SD of five independent donors. Samples were compared to medium control using a paired t-test (SLC: p = 0.0240). (D) 0.1 × 10⁶ macrophages were incubated with Gran1 for 24 h. Cell viability was measured by PrestoBlue assay. Bars show the mean viability (%) + SEM of five independent experiments. (E) Zebrafish embryos were investigated for viability and phenotypes indicative of sublethal toxicity at 48 hpf after exposure for 24 h to Gran1 (1 µM), NRC-03 (positive control causing cytotoxicity), and Aqua ad injectabilia (negative control). The graph shows the affected zebrafish embryos (%) of two independent experiments with n = 30 embryos in each group. “Severe damage” indicates lysis or widespread necrosis, which precluded analysis of more specific sublethal phenotypes. “Altered phenotype” includes less severe lysis or necrosis (cytotoxicity), reduced or absent circulation or heart edema (cardiovascular toxicity), developmental delay or malformation (developmental toxicity), and reduced or absent touch response (neurotoxicity). |
Cytokine release, chemotaxis, and toxicity of Gran1: (A,B) 0.5 × 10⁶ macrophages or PBMC were incubated overnight with Gran1 or positive controls (LPS, 100 ng/mL or PHA, 20 µg/mL, for CCL-5) and the release of the cytokines (left panels) or chemokines (right panels) was determined after overnight incubation with enzyme-linked immunosorbent assay (ELISA). Background of CCL-2 and CCL-3 signals in unstimulated samples were deducted. The small numbers left from the black bars indicate the sensitivity of each ELISA in ng/mL. Bars represent the mean cytokine release + SEM (n = 7). (C) PBMC were incubated for 3 h in a chemotaxis chamber in the presence of Gran1 or SLC (5 µg/mL). The chemotaxis index was calculated by comparison with the number of migrated cells in stimulate samples to the number of migrated cells in un-stimulated samples. Bars represent the mean chemotaxis index + SD of five independent donors. Samples were compared to medium control using a paired t-test (SLC: p = 0.0240). (D) 0.1 × 10⁶ macrophages were incubated with Gran1 for 24 h. Cell viability was measured by PrestoBlue assay. Bars show the mean viability (%) + SEM of five independent experiments. (E) Zebrafish embryos were investigated for viability and phenotypes indicative of sublethal toxicity at 48 hpf after exposure for 24 h to Gran1 (1 µM), NRC-03 (positive control causing cytotoxicity), and Aqua ad injectabilia (negative control). The graph shows the affected zebrafish embryos (%) of two independent experiments with n = 30 embryos in each group. “Severe damage” indicates lysis or widespread necrosis, which precluded analysis of more specific sublethal phenotypes. “Altered phenotype” includes less severe lysis or necrosis (cytotoxicity), reduced or absent circulation or heart edema (cardiovascular toxicity), developmental delay or malformation (developmental toxicity), and reduced or absent touch response (neurotoxicity). |

Macrophage-specific uptake of Gran1 in mixed cell culture: (A) PBMC mixed with autologous macrophages (ratio 1:1) were incubated with Gran1 for 2 h and labelled using an anti-Gran1 antibody (1:200) and a Cy2-labelled secondary antibody. Cells were stained for MHC class II (red) and cell nuclei were stained with DAPI (blue). Original magnification ×63 (upper four panels) with 3.3 zoomed region of interest (magnification ×210, lower four panels). Data shown are representative for one out of three donors. (B) PBMC mixed with autologous macrophages were incubated with Gran1-Atto647N for 2 h, stained for MHC class II (MHCII-FITC), and analyzed by flow cytometry. The left panel shows a representative dot plot (n = 7). The histogram shows the percentage of Gran1-positive cells in MHC class II negative (red) and MHC class II positive (blue) population (representative donor, n = 7). The results of each individual donor are presented in the right panel. Statistical analysis was performed using a non-parametric Wilcoxon rank test for paired samples (p = 0.0156). (C) Uptake of Gran1 in MHC class II positive cells after 2 h of incubation at 4 °C and 37 °C. Box plots show the median (horizontal lines) with upper and lower quartile and whiskers indicating minimum and maximum values (n = 7). Statistical analysis was performed using a non-parametric Wilcoxon rank test for paired samples (p = 0.0156). |
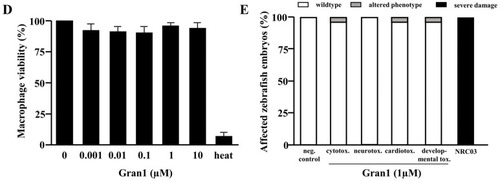
Uptake of Gran1 by Mtb-infected macrophages: (A) Macrophages were infected with NHS-AlexaFluor 647-labelled Mtb for 16 h, followed by 2 h incubation with Gran1. Gran1 was labelled using an anti-Gran1 antibody and a Cy2-labelled secondary antibody (green). Cell nuclei were stained with DAPI (blue). Images were acquired using an inverted laser scanning confocal microscope (Zeiss LSM 710). Images show representative areas for three donors. Original magnification x63 (upper three panels) with a 3.5-fold zoom on the region of interest (lower three panels). (B) The graph shows the numberof Gran1-labelled macrophages (%) in un-infected (black) and infected (white) cells for three independent donors. |
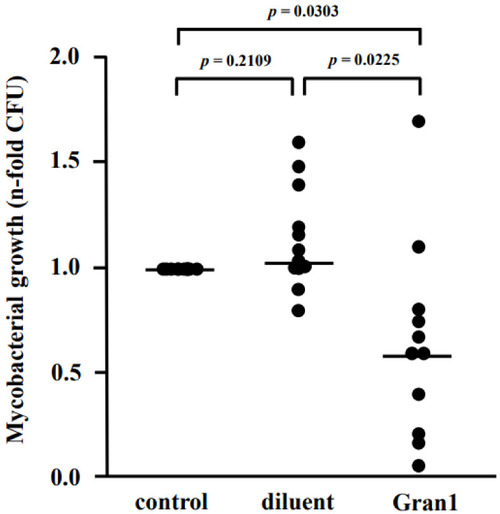
Gran1 inhibits growth of intracellular Mtb. Macrophages were infected with Mtb followed by incubation with Gran1 for 4 d. Multiplication of Mtb was determined by plating cell lysates on 7H11 agar plates. After 21 d of incubation, the number of colony-forming units (CFU) was determined. Lines indicate mean values and dots represent individual values of n-fold mycobacterial growth as compared to growth control (d4) for eleven individual donors. Statistical analysis was performed using multiple t-tests (Wilcoxon rank test, p = 0.05). |