
|
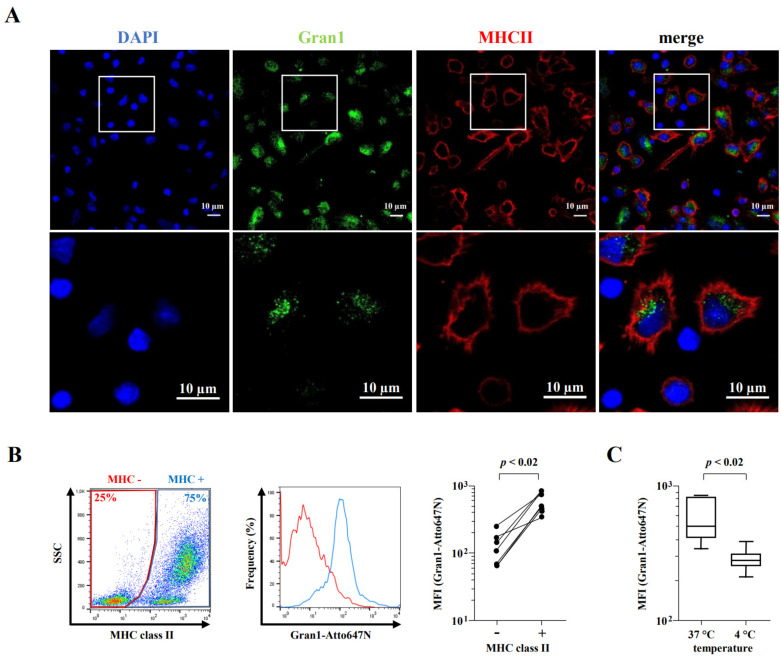
Figure 5
Macrophage-specific uptake of Gran1 in mixed cell culture: (A) PBMC mixed with autologous macrophages (ratio 1:1) were incubated with Gran1 for 2 h and labelled using an anti-Gran1 antibody (1:200) and a Cy2-labelled secondary antibody. Cells were stained for MHC class II (red) and cell nuclei were stained with DAPI (blue). Original magnification ×63 (upper four panels) with 3.3 zoomed region of interest (magnification ×210, lower four panels). Data shown are representative for one out of three donors. (B) PBMC mixed with autologous macrophages were incubated with Gran1-Atto647N for 2 h, stained for MHC class II (MHCII-FITC), and analyzed by flow cytometry. The left panel shows a representative dot plot (n = 7). The histogram shows the percentage of Gran1-positive cells in MHC class II negative (red) and MHC class II positive (blue) population (representative donor, n = 7). The results of each individual donor are presented in the right panel. Statistical analysis was performed using a non-parametric Wilcoxon rank test for paired samples (p = 0.0156). (C) Uptake of Gran1 in MHC class II positive cells after 2 h of incubation at 4 °C and 37 °C. Box plots show the median (horizontal lines) with upper and lower quartile and whiskers indicating minimum and maximum values (n = 7). Statistical analysis was performed using a non-parametric Wilcoxon rank test for paired samples (p = 0.0156).